"JPY Samurai Breakout Lite" logo
JPY Samurai Breakout Lite
"JPY Samurai Breakout Lite" uploaded image
Since 13/08/2025
336
Sales
2.93K
Free installs

⚔️JPY Samurai Breakout Lite — Simple Breakout Indicator for cTrader ⚔️

A lightweight version of the breakout indicator designed for traders who want simplicity and speed.
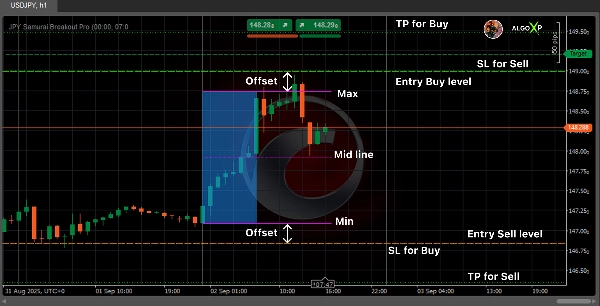
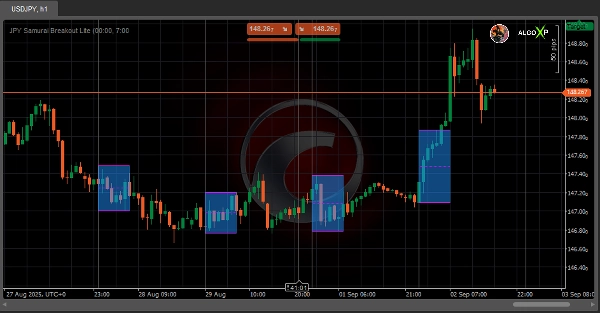
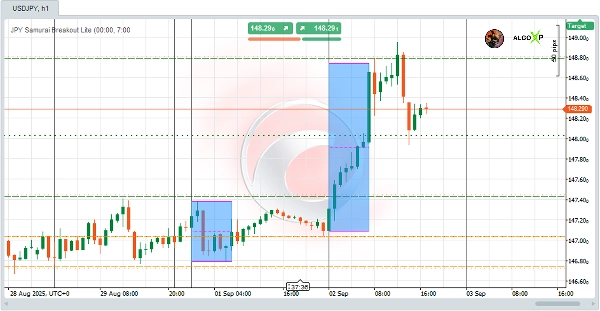
JPY Samurai Breakout Lite automatically plots the Asian session range and shows clear breakout levels (Buy/Sell, SL, TP) - without extra features or statistics.
Explore more resources and a detailed FAQ on AlgoXP

 📊 How to Use

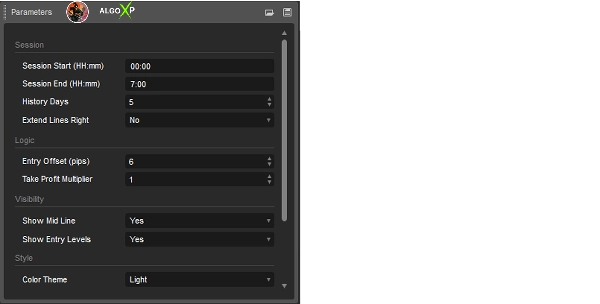
  • Take Profit = Box size × Multiplier.
  • Apply on JPY pairs (USDJPY, GBPJPY, EURJPY, AUDJPY).
  • Wait until Asian session ends → Box is drawn.
  • Watch for price breakout:
  • Above Buy Entry → Long setup.
  • Below Sell Entry → Short setup.
  • Stop Loss = opposite side of Box.

Main Features:

  • Automatic Asian session Box with High/Low levels.
  • Optional Mid-line for visual balance.
  • Buy/Sell breakout levels with Stop Loss and Take Profit.
  • Multi-day history view (default: 3 days, maximum 5 days).
  • Semi-transparent box fill for better visual clarity.
  • Predefined color themes: Dark and Light .

🎯 Perfect for:

  • Traders who want a clean chart setup.
  • Scalpers and intraday traders on JPY pairs (USDJPY, GBPJPY, EURJPY, AUDJPY).
  • Beginners who want to test breakout strategies visually.

Why Lite?

  • Just breakout levels, clean and ready.
  • No statistics, no complexity.

Limited-time offer: free through October 2025

Indicator profile
0.0
Reviews: 0
Customer reviews
No reviews for this product yet. Already tried it? Be the first to tell others!
Prop
Forex
USDJPY
Products available through cTrader Store, including trading bots, indicators and plugins, are provided by third-party developers and made available for informational and technical access purposes only. cTrader Store is not a broker and does not provide investment advice, personal recommendations or any guarantee of future performance.

More from this author

🌞 Smart Gold Grid. ATR Precision. + 1 800 000% ROI in 6 years backtest 🌞
34.3%
2.12
Profit factor
5.18%
Max drawdown
🌞 Smart Gold Grid. ATR Precision. +35% in 30 Days🌞
35.2%
2.12
Profit factor
5.18%
Max drawdown
🟢 Real swing-based support & resistance with ATR-powered half-bands 🔴
🌞 Smart Anchor Grid Engine for XAUUSD up to +230% in 30 Days🌞
218.1%
27
Profit factor
4.24%
Max drawdown
✨ Lisa EURUSD Breakout - Session Box Precision for EURUSD. Up to +176% in 30 Days✨
855%
4
Profit factor
0.25%
Max drawdown
✨ Lisa EURUSD Breakout - Session Box Precision for EURUSD. Up to +855% in 30 Days✨
855%
50
Profit factor
0.25%
Max drawdown
🐠 Free trend baseline - without the noise. Free limited version of Coral Filter X Pro 🐠
⚔️Full breakout trading workstation: session box, EP/TP/SL levels, on-chart ✓/✗ outcomes, pro-level analytics and more⚔️
⚔️Limited version. Draws clean session box (Tokyo / London / New York / Overlap) and optional breakout plan (EP/TP/SL)⚔️
🐠 Coral Filter X Pro turns trend detection into a simple, repeatable workflow 🐠
🦖 T-Rex Risk Guardian - your personal T-Rex that protects your account 🦖
✨Petra Oil Breakout - Session Box Precision for WTI & Brent. Up to +136% in 30 Days✨
136%
4.35
Profit factor
13.08%
Max drawdown

You may also like

Useful indicator for traders who want to visualize key price levels based on previous daily highs and lows.
Are essentially short intervals during which the algorithm seeks liquidity or adjusts price.....
Session VWAP Profile - Daily(standard deviations), Weekly, Monthly, Quarterly, Yearly
MA Quant Smart Money Concepts est un indicateur professionnel d'analyse technique avancée pour cTrader.
RSI with all acceptable MA types
Sniper Zone Pro: High-precision institutional zones and candle strength for identifying key market tests.
Advanced Market Sessions with ICT killzones
Forex Strength Meter for cTrader: 4 custom currencies, cross alerts, visual arrows. Trade smarter!
The KDJ oscillator display consists of 3 lines (K, D and J - hence the name of the display) and 2 levels.
Plots intraday VWAP and dynamic ±1/±2 standard deviation (SD) bands based on current day’s price and volume.
TMA Bands Essentials – Advanced Mean Reversion Tool
Tracks N-period highs/lows, HTF overlay, HUDs with ADX, RSI, session clocks. Customizable for precise trading.
Bollinger Band Cloud, Heiken Ashi, Trend Follower and Parabolic SAR.
Supertrend indicator change rate
Chart control panel — zoom presets, timeframe selector, favorite chart buttons, chart type switcher, and bid/ask lines.
Regression Channel plots dynamic upper/lower bands around price to highlight trend direction, volatility, and potential
ALGO XL — Keltner HeatFlow is not a normal Keltner Channel.
Detects HTF bias using CRT, Expansion & Swing Point patterns with SMT/PSP divergence — visualised in a floating candle
Since 13/08/2025
336
Sales
2.93K
Free installs