Indicator
RSI
Breakout
Supertrend
Adaptive Trend Channel
"Adaptive Trend Channel" logo
5.0
03/09/2025
160
Desktop
SinceΒ 03/10/2024
Sales
105
Free installs
16341
"Adaptive Trend Channel" uploaded image"Adaptive Trend Channel" uploaded image"Adaptive Trend Channel" uploaded image

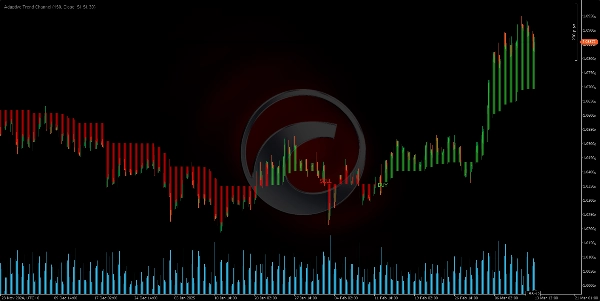
The AdaptiveTrendChannel is an indicator that helps you visualize market trends more clearly and dynamically. πŸ“ˆ Unlike a regular moving average, it adapts in real-time as the price evolves, allowing you to see when the trend is shifting. πŸ”„


πŸ› οΈ How Does It Work?

The first thing it does is generate a dynamic reference line that updates with each candle. πŸ•―οΈ Think of this line as a balance point, telling you whether the price is in an equilibrium zone or moving in a clear direction.

But this line doesn’t work alone! It also relies on internal levels that act as dynamic supports and resistances. πŸ’ͺ These levels are constantly adjusting based on recent highs and lows πŸ“‰πŸ“ˆ, meaning they aren’t fixedβ€”they adapt to market conditions in real time.

When the price moves above or below these dynamic levels, the indicator detects a trend change and generates signals. To make things even clearer, it colors the area between the reference line and the closing price, making trends visually obvious. πŸŽ¨πŸ‘€


πŸ“Œ How to Use It in Trading?

Now, how do you apply this in real trades? Easy.

βœ… If the price stays above the reference line for multiple candles, the market is considered bullish. 🟒
❌ If the price drops below the reference line, the market is considered bearish. πŸ”΄

Since this line dynamically adjusts and filters out market noise, it gives you a cleaner view of the trend.

Additionally, the indicator tracks recent crossovers:
πŸ”» If the price crosses below a key internal level, it signals a potential bearish phase.
πŸ”Ί If the price crosses above a key internal level, it signals a potential bullish phase.

With this information, the indicator does two key things:

🎨 Changes the color of the line and chart area, giving you an instant visual cue on trend direction.
πŸ“’ Generates buy/sell signals when a trend shift is detected.


πŸ”₯ Why Is It So Powerful?

The AdaptiveTrendChannel helps you stay on the right side of the trend and avoid trading against market momentum. It highlights key moments for entry and exit points, giving you a clear visual reference for smarter trading decisions.

When combined with other tools like volume analysis or price action, it becomes a powerful ally for filtering trades and improving entry precision. πŸš€πŸ’°


Ctrader Store indicators:


Channel Breakout System

Fair Value Gap Sessions

 BOS & CHOCH

ZigZag

Supertrend

Market Imbalance

Adaptive Trend Channel 

Dynamic Market Structure
Analysis of Turning Points

Order Block

Fibonacci Linear
Regression Multi-timeframe

Volume POC Heatmap

Dynamic RSI

Momentum Fair Value Gap

Market Flow Projection

Dynamic Trend Gradient

Multi-Level Candle Bias
Tracker

Zig-Zag Extremity Tracker

Reactive Moving Average

Auto-Trend Channel

Auto Support and
Resistance Trend Lines

All Support and
Resistance Levels

Leverage Liquidation Map

Zones Supply Demand

Dynamic Range Momentum


5.0
Reviews: 1
5
100 %
4
0 %
3
0 %
2
0 %
1
0 %
Customer reviews
August 18, 2025
Pros: Dynamic trend channel adapts to volatility. Clear visualization, works on all timeframes. Useful for entries, exits, and risk management. Cons: No alerts, MTF mode, or preset saving. Can be too sensitive on low timeframes.
More from this author
Indicator
RSI
Breakout
XAUUSD
+6
ZigZag
ZigZag filters noise, spots trends, patterns, pivots, aiding analysis, trade management, and confirmations. πŸ“‰πŸ“ˆ
Indicator
RSI
Breakout
XAUUSD
+6
Order Block
Identify bullish and bearish Order Blocks to spot key support/resistance levels and potential trend reversals! πŸ“ˆπŸ”„
Indicator
RSI
Breakout
XAUUSD
+5
Auto-Trend Channel
Adaptive trend channel using linear regression and Pearson correlation for dynamic support, resistance, and trends.
Indicator
RSI
XAUUSD
Breakout
+5
BOS & CHOCH
Market structural patterns , specifically the concepts of Change of Character (ChoCH) πŸ”„ and Break of Structure (BoS) πŸ’₯
Indicator
RSI
Breakout
XAUUSD
+5
Zones Supply Demand
πŸ“ŠZones Supply & Demand: Identifies key price levels with high volume concentration, marking Supply/Demand Zones & Marke
Indicator
RSI
Breakout
Supertrend
All Support and Resistance Levels
"Identify key market zones and visualize support/resistance from multiple timeframes on a single chart.
Indicator
RSI
Breakout
XAUUSD
+6
Volume POC Heatmap
πŸ“Š Shows volume by price levels, highlights POC, and key zones. Identifies dynamic support/resistance and imbalances.
Indicator
RSI
Breakout
XAUUSD
+5
Supertrend
πŸ’Ή Define a price channel πŸ“ˆ and determine trend direction (bullish 🟒 or bearish πŸ”΄).
Indicator
RSI
Breakout
XAUUSD
+6
Fair Value Gap Sessions
identify and highlight temporary market inefficiencies known as "fair value gaps" 🚨 within specific trading Sessions.
Indicator
RSI
Breakout
XAUUSD
+4
Dynamic Market Structure Analysis of Turning Points
Identify market structure effortlessly with swing highs, lows, CHoCH, and BOS levels for smart trading decisions! πŸ“ŠπŸ”"
Indicator
Indices
RSI
XAUUSD
+7
RSI Divergence
Detects bullish and bearish divergences
Indicator
RSI
Breakout
Supertrend
Trend Heikin Multi MA
πŸš€ TrendHeikinMultiMA: Advanced trend detection using Heikin-Ashi smoothing & MAs! Eliminates noise, confirms real trend
Indicator
RSI
Breakout
XAUUSD
+4
Multi-Level Candle Bias Tracker
Price direction by calculating the probability of reaching new highs/lows. Shows levels & statsπŸ“ˆ
Indicator
RSI
Breakout
Supertrend
Leverage Liquidation Map
πŸ“Š Liquidation Map: Potential areas where highly leveraged investors might face liquidations.
Indicator
RSI
Breakout
Supertrend
Market Trend OB
Price action to detect when the market changes trend (MSB) and defines, order blocks , ZigZag etc.πŸ“Š
Indicator
RSI
Breakout
Supertrend
Zig-Zag Extremity Tracker
Dynamically adjusts regression channels based on ZigZag extremes, resetting when price breaks bands to track real trends
Indicator
RSI
Breakout
Supertrend
+3
Fibonacci Linear Regression Multi-timeframe
Combining Fibonacci levels and regression to analyze multidimensional market trends across multiple timeframesΒ‘
Advanced Market Structure Bos,Choch,SwinLevels, Order Blog
Advanced price action toolΒ that combines multiple technical analysis concepts
You may also like
Indicator
NAS100
XAUUSD
Commodities
+11
WHT AIRRA
Indicator that auto-calculates SL/TP via volatility. 3 layers: digital filtering, recursive Bayes, adaptive factor
Indicator
VWAP
RSI
Breakout
+7
Anchored VWAP by LudwigICT
πŸ“ˆ Anchored VWAP with auto High/Low, session resets, Daily VWAP & TWAP β€” precise, Pine-accurate port.
[Hamster-Coder] Pivot Points (Demo)
[Hamster-Coder] Pivot Points (Demo)
Indicator
Indices
Prop
Stocks
+3
Fractals
Fractals is a precision-engineered trading indicator for cTrader that reveals the hidden architecture of price action.
Vishal Volume Profile v2.0
Volume Profile plots traded volume at each price level, highlighting high activity zones of precise support & resistance
ScalperSignalVisual
Overview of the Fade Breakout Visualizer Indicator
ictkillzonesfromnovem
ICT ALL KΔ°LL ZONES, LONDON , ASΔ°A, NY AM, NY LUNCH, NY PM
Indicator
RSI
Breakout
XAUUSD
+6
Order Block
Identify bullish and bearish Order Blocks to spot key support/resistance levels and potential trend reversals! πŸ“ˆπŸ”„
Volume Profile Fixed Range
Professional Volume Profile Indicator - Shows volume distribution, POC, Value Areas & Buy/Sell pressure.
Indicator
NAS100
Indices
XAUUSD
+4
BSL_SSL_Liqudity
Buy-Side & Sell-Side Liquidity (BSL/SSL) Indicator
Indicator
Indices
Prop
Stocks
+3
Dynamic Candle Timer v1.5 2025
Dynamic Candle Timer is a fully customizable feature-packed indicator that offers multiple count-down/up modes and...
Indicator
Signal
FractalArrowBuySell
Fractal Arrow Buy and Sell Indicator
Indicator
Signal
Scalping
[Stellar Strategies] Linear Regression Candles 1.1
Approach to price analysis by visualizing candlestick data through the lens of linear regression slopes πŸ“ˆπŸ“‰
True Deviation System
True Deviation System – Precision Meets Professional Trading
Advanced Market Structure Bos,Choch,SwinLevels, Order Blog
Advanced price action toolΒ that combines multiple technical analysis concepts
Indicator
Grid
NAS100
NZDUSD
+15
RangeBoxLevel
This technical analysis indicator provides information on market sentiment, trend and price levels....
Market Entropy
Market entropy + DC. Spot crystallization/chaos shifts with an optional on-chart overlay.
pATR
An indicator that redefines ATR by applying a percentile-based filter giving traders a grounded view of volatility.