Indicator
RSI
Breakout
Supertrend
Leverage Liquidation Map
"Leverage Liquidation Map" logo
03/09/2025
3
Desktop
"Leverage Liquidation Map" uploaded image"Leverage Liquidation Map" uploaded image"Leverage Liquidation Map" uploaded image"Leverage Liquidation Map" uploaded image"Leverage Liquidation Map" uploaded image

๐Ÿ” Examines volume data over a specific historical period, highlighting potential areas where highly leveraged investors might face liquidations, providing valuable insights into market behavior.

What does this indicator do?

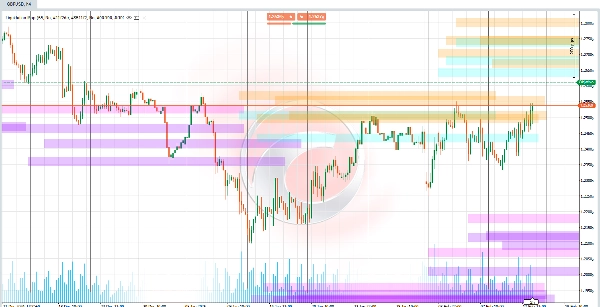
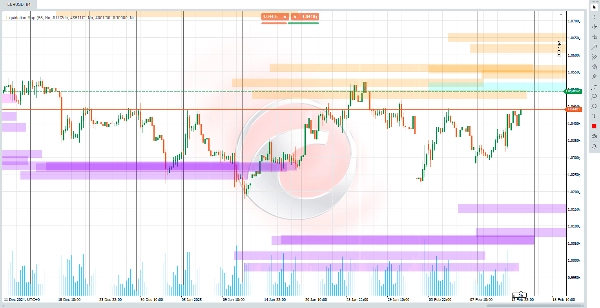
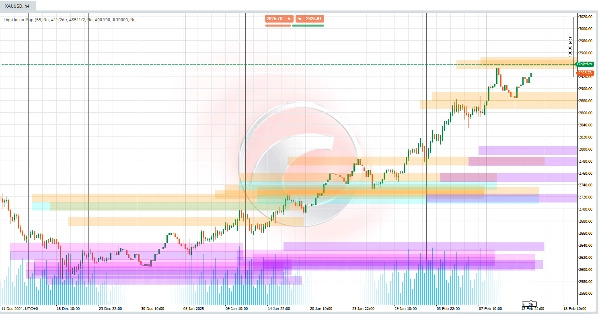
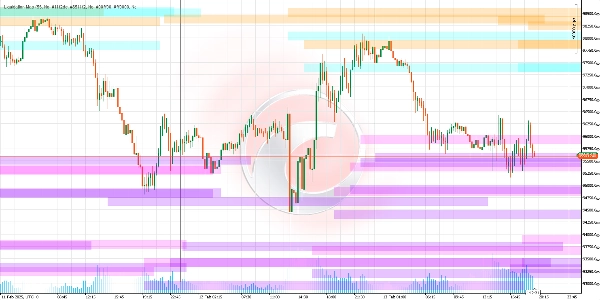
This algorithm identifies price levels where massive liquidations of leveraged positions (such as 5x, 10x, 25x, 50x, or 100x) are likely to occur. These levels act as "magnets" for price movements, as liquidations can trigger sharp market swings. The indicator draws horizontal lines on the chart, representing these thresholds and projecting them into the future to anticipate key zones of interest.

How are these levels calculated?

  1. Price Pivot Detection:
    ๐Ÿ”„ It identifies recent highs and lows in the chart (points where the price changes direction). These pivots are the foundation for calculating liquidation levels.
  2. Volume as a Trigger:
    ๐Ÿ“Š Compares current volume to a historical average. If the volume exceeds certain thresholds (e.g., 1.2x the average for 100x), it activates the corresponding liquidation levels.
  3. Liquidation Formula:
    The higher the leverage, the closer the liquidation level is to the current price.
    • For long positions: The liquidation level is set below the pivot low, calculated based on the leverage (e.g., 2% below for 50x).
    • For short positions: The level is set above the pivot high, using the same principle.

What can you expect when using it?
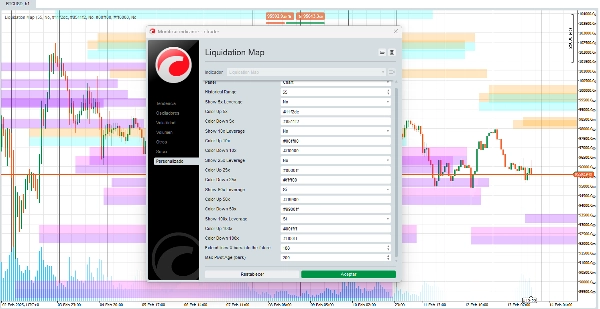
  • Liquidity Lines: ๐ŸŽจ Youโ€™ll see customizable horizontal lines representing zones where the market might experience high volatility due to liquidations.
  • Configurable Leverages: โš™๏ธ You can enable/disable levels for each leverage type (e.g., focus only on 50x and 100x).
  • Color Customization: ๐ŸŒˆ You can choose the color for each liquidation range, tailoring the visualization to your preferences.
  • Congestion Zones: ๐ŸŽฏ Multiple lines close to each other suggest high-risk/high-reward areas where multiple liquidations could occur simultaneously.

How to interpret the signals?

  • Price Approaching a Line: ๐Ÿšจ If the price nears a liquidation level (especially with high volume), the likelihood of a sharp movement increases.
  • Color and Transparency: ๐ŸŽจ Colors vary by leverage (e.g., blue for 25x, orange for 50x). Transparency indicates the "strength" of the associated volume (darker lines = more significant volume).

Why is it useful?

  • Proactive Forecasting: ๐Ÿ”ฎ It doesnโ€™t just analyze the past; it projects future levels based on current conditions.
  • Market Psychology Focus: ๐Ÿง  Forced liquidations often create chain reactions (e.g., stop-loss orders triggering more sell-offs). This indicator helps you anticipate them.
  • Customization: ๐Ÿ› ๏ธ Adapt the visualization to your strategy (e.g., prioritize higher leverages in volatile markets).

Limitations to consider

  • Volume Dependency: ๐Ÿ“‰ If volume is low or historical data is insufficient, signals may be less reliable.
  • Not a Crystal Ball: ๐Ÿ”ฎ Levels indicate probable zones, not certainties. Always combine it with other analyses.
  • Dynamic Environment: ๐ŸŒ In markets with unexpected news, liquidations can occur outside projected levels.

Ctrader Store indicators:


Channel Breakout System

Fair Value Gap Sessions

 BOS & CHOCH

ZigZag

Supertrend

Market Imbalance

Adaptive Trend Channel 

Dynamic Market Structure
Analysis of Turning Points

Order Block

Fibonacci Linear
Regression Multi-timeframe

Volume POC Heatmap

Dynamic RSI

Momentum Fair Value Gap

Market Flow Projection

Dynamic Trend Gradient

Multi-Level Candle Bias
Tracker

Zig-Zag Extremity Tracker

Reactive Moving Average

Auto-Trend Channel

Auto Support and
Resistance Trend Lines

All Support and
Resistance Levels

Leverage Liquidation Map

Zones Supply Demand

Dynamic Range Momentum

0.0
Reviews: 0
Customer reviews
No reviews for this product yet. Already tried it? Be the first to tell others!
More from this author
Indicator
RSI
Breakout
XAUUSD
+6
ZigZag
ZigZag filters noise, spots trends, patterns, pivots, aiding analysis, trade management, and confirmations. ๐Ÿ“‰๐Ÿ“ˆ
Indicator
RSI
Breakout
XAUUSD
+6
Order Block
Identify bullish and bearish Order Blocks to spot key support/resistance levels and potential trend reversals! ๐Ÿ“ˆ๐Ÿ”„
Indicator
RSI
Breakout
XAUUSD
+5
Auto-Trend Channel
Adaptive trend channel using linear regression and Pearson correlation for dynamic support, resistance, and trends.
Indicator
RSI
XAUUSD
Breakout
+5
BOS & CHOCH
Market structural patterns , specifically the concepts of Change of Character (ChoCH) ๐Ÿ”„ and Break of Structure (BoS) ๐Ÿ’ฅ
Indicator
RSI
Breakout
XAUUSD
+5
Zones Supply Demand
๐Ÿ“ŠZones Supply & Demand: Identifies key price levels with high volume concentration, marking Supply/Demand Zones & Marke
Indicator
RSI
Breakout
Supertrend
All Support and Resistance Levels
"Identify key market zones and visualize support/resistance from multiple timeframes on a single chart.
Indicator
RSI
Breakout
XAUUSD
+6
Volume POC Heatmap
๐Ÿ“Š Shows volume by price levels, highlights POC, and key zones. Identifies dynamic support/resistance and imbalances.
Indicator
RSI
Breakout
XAUUSD
+5
Supertrend
๐Ÿ’น Define a price channel ๐Ÿ“ˆ and determine trend direction (bullish ๐ŸŸข or bearish ๐Ÿ”ด).
Indicator
RSI
Breakout
XAUUSD
+6
Fair Value Gap Sessions
identify and highlight temporary market inefficiencies known as "fair value gaps" ๐Ÿšจ within specific trading Sessions.
Indicator
RSI
Breakout
XAUUSD
+4
Dynamic Market Structure Analysis of Turning Points
Identify market structure effortlessly with swing highs, lows, CHoCH, and BOS levels for smart trading decisions! ๐Ÿ“Š๐Ÿ”"
Indicator
Indices
RSI
XAUUSD
+7
RSI Divergence
Detects bullish and bearish divergences
Indicator
RSI
Breakout
Supertrend
Trend Heikin Multi MA
๐Ÿš€ TrendHeikinMultiMA: Advanced trend detection using Heikin-Ashi smoothing & MAs! Eliminates noise, confirms real trend
Indicator
RSI
Breakout
XAUUSD
+4
Multi-Level Candle Bias Tracker
Price direction by calculating the probability of reaching new highs/lows. Shows levels & stats๐Ÿ“ˆ
Advanced Market Structure Bos,Choch,SwinLevels, Order Blog
Advanced price action toolย that combines multiple technical analysis concepts
Indicator
RSI
Breakout
Supertrend
Market Trend OB
Price action to detect when the market changes trend (MSB) and defines, order blocks , ZigZag etc.๐Ÿ“Š
Indicator
RSI
Breakout
Supertrend
Zig-Zag Extremity Tracker
Dynamically adjusts regression channels based on ZigZag extremes, resetting when price breaks bands to track real trends
Indicator
RSI
Breakout
Supertrend
+3
Fibonacci Linear Regression Multi-timeframe
Combining Fibonacci levels and regression to analyze multidimensional market trends across multiple timeframesยก
Indicator
RSI
Breakout
Signal
+1
Dynamic Trend Gradient
Identifies trends with moving averages & volatility. Base levels = bullish ๐Ÿ‚ or bearish ๐Ÿป signals. Reversals detected!
You may also like
Market Polarity Zones
implifies market analysis by automatically identifyingย bullish ๐Ÿš€ or bearish ๐Ÿป phasesย and marking key levels where ....
Indicator
Grid
NAS100
NZDUSD
+17
Institutional Volume Supply Demand
Volume Profile Supply Demand
Indicator
NAS100
NZDUSD
Breakout
+8
Pivot Breakout Detector
๐ŸŽฏ Automatically identify significant breakouts from price consolidation zones.
Anchored VWAP Buttons
Candles_Painter
Overlay HTF context on any chart: color bars by HTF and draw filled HTF bodies with optional High/Low lines.
Market Sessions V2_NSC
Market Session V2: Full Control. colors, history, session/text toggles, font size. Elevate your strategy!
Indicator
Indices
Breakout
Prop
+9
IBS Indicator
IBS Indicator โ€“ Measures price position within bars for smarter trades. Works on all markets & timeframes.
LaguerreRSI
Laguerre RSI: smoother, faster RSI with less noise. Great for spotting reversals and timing entries.
trPDHLC
this indicator shows previous day high low and closed with precise manner.
Indicator
Stocks
Forex
MACD
+1
SmartBot-Volume MACD
a revolutionary indicator that integrates volume into MACD.
Indicator
Breakout
PDHL
PDHL - Previous Day High&Low
Indicator
NAS100
Indices
Breakout
+7
ORB Range with FVGs
This indicator plots the 15m opening range of the NY session with the first N FVGs presented on the chart after the open
Indicator
Breakout
BreakOut_Probability_Expo
Break Out Probability Experimental indicator. Credits for this indicator goes to Zeiierman !!!
Trend Direction Force Index - TDFI (Alerts)
Spot Strong Trends Early & Filter Market Noise
VegaXLR - RSI and StochRSI Alerts
VegaXLR's cTrader StochRSI identifies overbought/oversold RSI levels for precise trade entries.
Indicator
Indices
RSI
Signal
Rsi + Volume
This indicator combines RSI (Relative Strength Index) with volume analysis to generate more reliable trading signals.
Rsi Scalp Indi
RSI Scalper delivers splitโ€‘second entries on volatile assets.