Indicator
RSI
Breakout
XAUUSD
ATR
Commodities
Signal
Supertrend
Crypto
BTCUSD
Fair Value Gap Sessions
"Fair Value Gap Sessions" logo
5.0
03/09/2025
1166
Desktop
"Fair Value Gap Sessions" uploaded image"Fair Value Gap Sessions" uploaded image"Fair Value Gap Sessions" uploaded image

Pinescriptlabs Store indicators:                        Pinescriptlabs  Store cBots :  (cBot) Gold & BTC BreakoutSession Pivots(new)

PRICE ACTION  (New)

S&R Structural ZigZag                                

ZigZag

 BOS & CHOCH

Zones Supply Demand

Leverage Liquidation Map

Auto-Trend Channel


Volume POC Heatmap


PREMIUM SSL CHANNEL

Prediction Based on Linreg & ATR

 ICT Power of 3 
                                                   

SmartTrend Support &
Resistance
Lines
       

Fair Value Gap Sessions                


RSI Trend Trigger

Channel Breakout System

Supertrend

Market Imbalance

Adaptive Trend Channel 

Dynamic
Market Structure
Analysis
of
Turning
Points

Order Block

Fibonacci
Linear
Regression
Multi-timeframe

Dynamic RSI

Momentum Fair Value Gap

Market Flow Projection

Dynamic Trend Gradient

Multi-Level
Candle Bias
Tracker

Zig-Zag Extremity Tracker

Reactive Moving Average

Auto
Support and
Resistance
Trend
Lines

All
Support and
Resistance
Levels

Dynamic Range Momentum

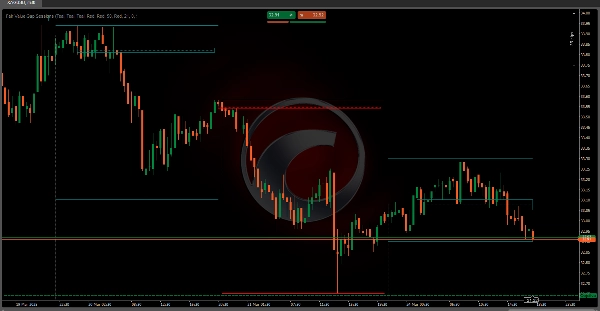
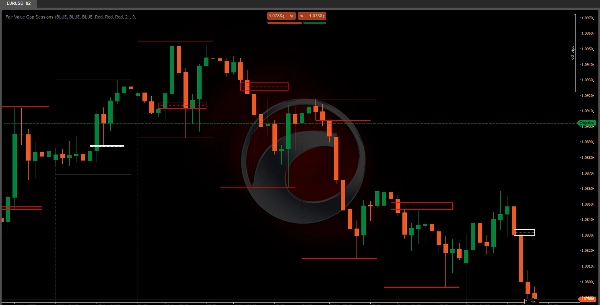
Fair Value Gap Sessions 📊💰

The Fair Value Gap (FVG) indicator is a sophisticated trading tool designed to identify and highlight temporary market inefficiencies known as "fair value gaps" 🚨 within specific trading sessions. These gaps represent moments where market price moves rapidly ⚡, creating an imbalance between buyers and sellers.

Key Technical Mechanisms 🔧

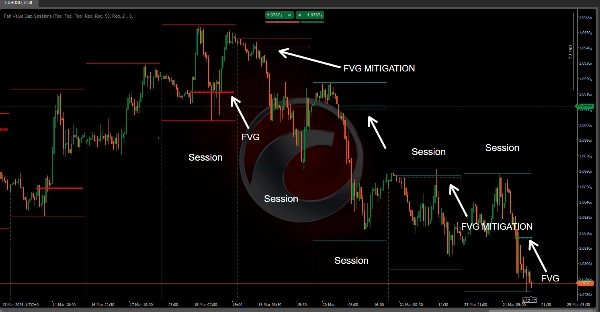
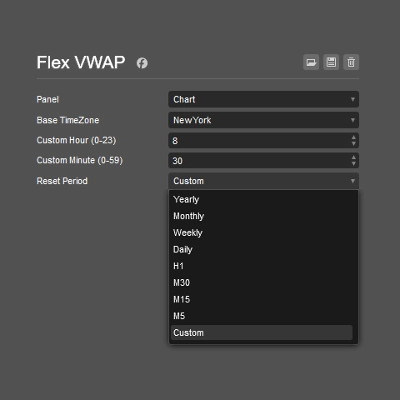
Session-Based Architecture 🕒
• Implements a precise, configurable session-based analysis approach
• Allows traders to define custom session start times with UTC or local time zone support 🌍
• Creates a dynamic session boundary that resets and tracks market behavior 🔄

Fair Value Gap Detection Logic 🔎
• Uses advanced price action analysis across multiple consecutive price bars
• Identifies gaps by comparing:
o Consecutive bar high and low prices 📈📉
o Previous bar's closing price ✅
o Current bar's price structure 🔄

Gap Classification 🏷️
The indicator distinguishes between two primary gap types:

  1. Bullish Fair Value Gap 📈
    o Occurs when price jumps above previous high 🔺
    o Indicates potential upward market momentum 🚀
    o Signals possible buying pressure 💸
  2. Bearish Fair Value Gap 📉
    o Occurs when price drops below previous low 🔻
    o Suggests potential downward market momentum ⬇️
    o Signals possible selling pressure 🛑

Trading Applications 📱💼

Strategic Insights 💡
• Helps traders visualize market inefficiencies 🖼️
• Provides early warning of potential trend reversals ⚠️
• Offers precise entry and exit point identification 🎯

Risk Management Features 🛡️
• Color-coded visualization of gap states 🎨
• Tracks gap "mitigation" (when price returns to the gap zone) ↔️
• Allows customizable color settings for different market conditions 🎨

Technical Visualization 🎨

The indicator creates two primary visual elements:

  1. Gap Area Rectangle 🟩
    o Represents the price range of the identified gap 📐
    o Dynamically extends throughout the trading session ➡️
    o Changes color based on gap status (active/mitigated) 🟩➡️🟨
  2. Level Line 📏
    o Positioned at the midpoint of the gap ⚫
    o Helps traders quickly identify the gap's central price zone 📍
    o Uses different line styles to indicate gap state ➔

Practical Trading Strategies 📝

Entry Signal Strategies 🚦
• Use gap detection as a potential trend continuation signal 🔄
• Look for price returning to (mitigating) the gap as a confirmation ✅
• Combine with other technical indicators for robust decision-making 🤝

Risk Management Techniques 🛡️
• Set stop-loss near gap boundaries ⛔
• Use gap midpoint as potential support/resistance level 🪜
• Monitor gap mitigation as a potential trend reversal indicator ↔️⚠️

Configuration Flexibility ⚙️
• Customizable session start time ⏰
• Time zone configuration (UTC/Local) 🌍

By understanding and properly implementing the Fair Value Gap Sessions indicator, traders can gain deeper insights into market dynamics, identify potential trading opportunities, and make more informed decisions based on price action inefficiencies. 🧠📈


5.0
Reviews: 4
5
100 %
4
0 %
3
0 %
2
0 %
1
0 %
Customer reviews
July 23, 2025
July 14, 2025
Pros: Automatically identifies and extends FVG zones per session. Clean visualization, customizable session and display settings. Cons: No alerts or tooltips. Doesn’t save template settings. Requires confirmation for trading decisions.
May 13, 2025
April 14, 2025
I have just discovered this one and it looks like something that will minimize my daily work routine because I do all these to find areas of LIQUIDITY. Thanks Champ.
More from this author
Indicator
RSI
Breakout
XAUUSD
+6
ZigZag
ZigZag filters noise, spots trends, patterns, pivots, aiding analysis, trade management, and confirmations. 📉📈
Indicator
RSI
Breakout
XAUUSD
+6
Order Block
Identify bullish and bearish Order Blocks to spot key support/resistance levels and potential trend reversals! 📈🔄
Indicator
RSI
Breakout
XAUUSD
+5
Auto-Trend Channel
Adaptive trend channel using linear regression and Pearson correlation for dynamic support, resistance, and trends.
Indicator
RSI
XAUUSD
Breakout
+5
BOS & CHOCH
Market structural patterns , specifically the concepts of Change of Character (ChoCH) 🔄 and Break of Structure (BoS) 💥
Indicator
RSI
Breakout
XAUUSD
+5
Zones Supply Demand
📊Zones Supply & Demand: Identifies key price levels with high volume concentration, marking Supply/Demand Zones & Marke
Indicator
RSI
Breakout
Supertrend
All Support and Resistance Levels
"Identify key market zones and visualize support/resistance from multiple timeframes on a single chart.
Indicator
RSI
Breakout
XAUUSD
+6
Volume POC Heatmap
📊 Shows volume by price levels, highlights POC, and key zones. Identifies dynamic support/resistance and imbalances.
Indicator
RSI
Breakout
XAUUSD
+5
Supertrend
💹 Define a price channel 📈 and determine trend direction (bullish 🟢 or bearish 🔴).
Indicator
Indices
RSI
XAUUSD
+7
RSI Divergence
Detects bullish and bearish divergences
Indicator
RSI
Breakout
XAUUSD
+4
Dynamic Market Structure Analysis of Turning Points
Identify market structure effortlessly with swing highs, lows, CHoCH, and BOS levels for smart trading decisions! 📊🔍"
Indicator
RSI
Breakout
XAUUSD
+4
Multi-Level Candle Bias Tracker
Price direction by calculating the probability of reaching new highs/lows. Shows levels & stats📈
Indicator
RSI
Breakout
Supertrend
Trend Heikin Multi MA
🚀 TrendHeikinMultiMA: Advanced trend detection using Heikin-Ashi smoothing & MAs! Eliminates noise, confirms real trend
Indicator
RSI
Breakout
Supertrend
Market Trend OB
Price action to detect when the market changes trend (MSB) and defines, order blocks , ZigZag etc.📊
Indicator
RSI
Breakout
Supertrend
Leverage Liquidation Map
📊 Liquidation Map: Potential areas where highly leveraged investors might face liquidations.
Indicator
RSI
Breakout
Supertrend
Swing Levels
🔍 Automatically detect support and resistance levels based on "swings" or pivots
Advanced Market Structure Bos,Choch,SwinLevels, Order Blog
Advanced price action tool that combines multiple technical analysis concepts
Indicator
RSI
Breakout
Supertrend
+3
Fibonacci Linear Regression Multi-timeframe
Combining Fibonacci levels and regression to analyze multidimensional market trends across multiple timeframes¡
Indicator
RSI
Breakout
Supertrend
Zig-Zag Extremity Tracker
Dynamically adjusts regression channels based on ZigZag extremes, resetting when price breaks bands to track real trends
You may also like
Indicator
NAS100
NZDUSD
XAUUSD
+10
Atlas Seasonal Returns Heatmap
🧭 See when your market tends to move—by Month, Day-of-Week, or Hour-of-Day🧭
Indicator
RSI
Indices
Signal
+2
[Stellar Strategies] Ultimate Trend & Momentum Dashboard
A comprehensive cTrader indicator designed to give you a quick, at-a-glance understanding of market sentiment 📈📉
Indicator
NAS100
NZDUSD
XAUUSD
+14
Volume Profile Pivot Anchored
Anchor volume profiles to pivots with POC, VAH, VAL and real-time insights for clearer trade decisions.
Indicator
Indices
XAUUSD
Breakout
+8
Phoenix Zones
Phoenix Zones - Detector de Reversiones Críticas
Market Sessions
Market Sessions is very important for traders.
[Hamster-Coder] Moving Average
Universal Moving Average indicator with extended features
Indicator
XAUUSD
Commodities
Forex
+3
Silver Bullet by LudwigICT
Indicator
Breakout
ATR
Signal
[Stellar Strategies] Market Structure Breakout
Flags breakouts of recent highs/lows on cTrader charts. Shows arrows/lines. Optional trend filter & sound alerts 📉📈
Indicator
RSI
EURUSD
MACD
Supply&Demand
Precision Supply & Demand zones indicator—automatically plots key buy/sell areas on your chart for smarter entries.
Indicator
Indices
Breakout
Commodities
+3
Trend Lines Auto - FXMaster
Auto Trend Line Indicator for cTrader
Indicator
Indices
Prop
Stocks
+3
Smooth Heiken Ashi
The Smooth Heiken Ashi indicator is a refined charting tool designed to filter out market noise and highlight true price
Indicator
Breakout
PDHL
PDHL - Previous Day High&Low
Market Polarity Zones
implifies market analysis by automatically identifying bullish 🚀 or bearish 🐻 phases and marking key levels where ....
Zero Lag Exponential Moving Average
ZLEMA (Zero Lag EMA) is a faster, smoother version of EMA, ideal for capturing quick market shifts and trends.
Buy and sell indicator
Buy and Sell Signals
Side Volume Profile
Right-anchored cTrader Volume Profile with VAH/VAL/POC, LVZ, top volume+EMA, themes, and fast, readable visuals.
Indicator
Indices
ATR
Forex
+1
[Stellar Strategies] Market Regime Filter
Filters market regimes (trend/range/pullback) using MAs, ADX, ATR/BBW Vol, opt. Volume. Helps adapt strategy. 📉📈