Brokers & props
For business
00
Days
:
00
Hours
:
00
Minutes
:
00
Seconds
Indicator
ZigZag
NAS100
RSI
XAUUSD
ATR
Signal
Supertrend
EURUSD
MACD
GBPUSD
WAVETREND_withSourceCode
25/10/2025
Desktop
Since 16/03/2025
Free installs
256
"WAVETREND_withSourceCode" uploaded image"WAVETREND_withSourceCode" uploaded image"WAVETREND_withSourceCode" uploaded image"WAVETREND_withSourceCode" uploaded image"WAVETREND_withSourceCode" uploaded image

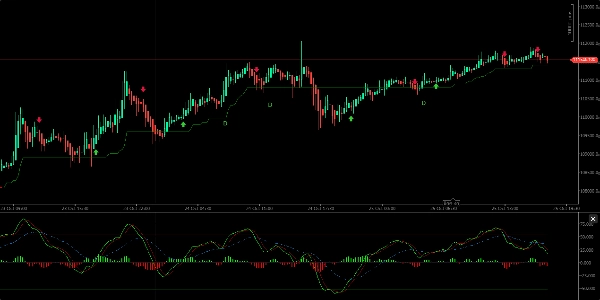
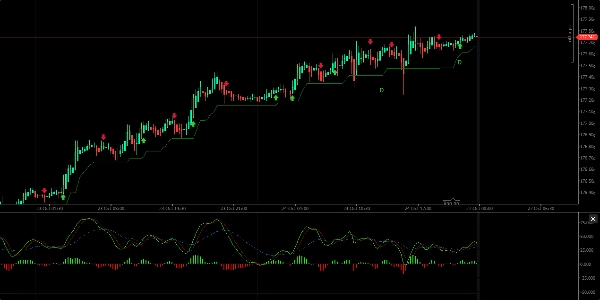
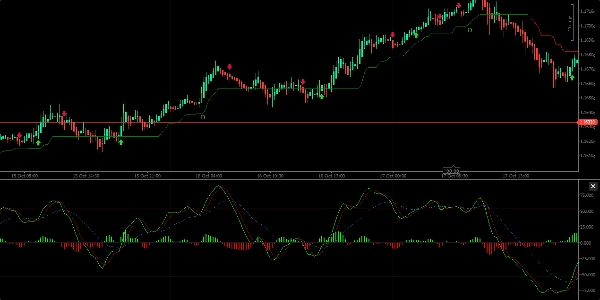
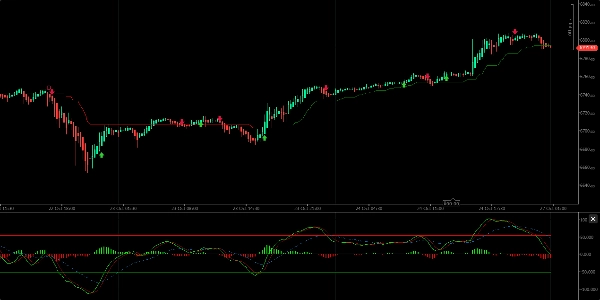
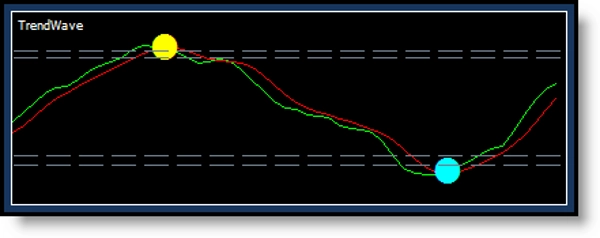
It provides buy-sell signals, trend direction indication, and identifies overbought and oversold zones. Visually, it comprises two value lines with a cloud/histogram in the center, which moves above and below a midline, representing rising or falling trends.

Key Features:

  • Buy signals occur when the green line crosses the red line upwards; sell signals when the green line crosses downward.
  • It shows trend direction with cloud waves above or below the midline.
  • The indicator displays green (buy) and red (sell) dots on crossing points, with corresponding candle color changes (yellow for buy, turquoise for sell).
  • Best used on 12-hour or 1-day intervals to avoid excessive short-term noise.
  • The indicator can identify divergences between price and momentum (regular bullish and bearish divergence), signaling potential price reversals.
  • It is advised to combine WaveTrend with other indicators like WMA, CMF, RSI, and MACD for more reliable trading decisions.

Overall, WaveTrend is a functional tool useful for identifying trend direction and trading signals but should be used alongside other analysis tools for confirmation.

0.0
Reviews: 0
Customer reviews
No reviews for this product yet. Already tried it? Be the first to tell others!
You may also like
Indicator
XAUUSD
Commodities
ATR
+1
[Stellar Strategies] Visual Trend Momentum
Visual Trend Momentum is a MA/ATR/Volume trend tool. Visual signals for strong trends & reversals. Customizable. 📈📉
Indicator
Grid
RSI
Breakout
+20
Logarithmic Framework by LudwigICT
Reversal Probability Engine
Detecting reversal zones + multidimensional mapping of support and resistance "Golden Levels.
Indicator
Grid
RSI
Breakout
+19
Buy and sell indicator
Buy and Sell Signals
Indicator
RSI
MACD
SmartBot-MACD & RSI Indicator
This indicator is a combination of MACD and RSI into one. This is perfect fusion and powerful indicator ever.
Indicator
NAS100
NZDUSD
XAUUSD
+11
Consolidation Zones
Identify and trade breakouts with Consolidation Zones! Visualize price consolidation areas for trading opportunities.
Indicator
Forex
Crypto
VegaXLR - Bar Close Alert Manager
Bar Close Alert Manager provides real-time alerts for bar closures with customizable notifications and automation.
VegaXLR - Fibonacci Alerts
Alerts you when price touches Fibonacci levels. Stay organized and trade efficiently!
Indicator
Indices
ATR
Forex
+1
[Stellar Strategies] Market Regime Filter
Filters market regimes (trend/range/pullback) using MAs, ADX, ATR/BBW Vol, opt. Volume. Helps adapt strategy. 📉📈
Indicator
NAS100
RSI
NZDUSD
+15
Inside Candle
Highlight market consolidation zones instantly with this Inside Candle indicator — precise, clean, and powerful.
Fair Value Gap
FVG Detector: Identify and label Fair Value Gaps, with age, status & multi-timeframe support.
Indicator
NAS100
NZDUSD
XAUUSD
+12
Coral Filter Lite
🐠 Free trend baseline - without the noise. Free limited version of Coral Filter X Pro 🐠
Breakout Mode Patterns
Brooks price action breakout mode patterns
Indicator
Indices
RSI
Prop
+5
MultiScalpScorePRO
🔍 MultiScalpScorePRO – Powerful real-time scoring system combining indicators for ultra-precise scalping signals.
CRT Pattern Indicator
The CRT indicator helps ICT traders identify candlestick patterns, enhancing analysis of higher timeframe on lower
Indicator
NAS100
NZDUSD
Martingale
+26
ATR_RR_EMASignalPanel
Trade the Trend Flip. Control the Risk. 🎯📈”
Indicator
Indices
RSI
Breakout
+9
Advanced HTF Trend Buy & Sell Trading System
Detects breakouts 📈 auto-draws levels 🚀 confirms trends 🐻 dynamic signals 🎨 customizable for any asset & timeframe.
MTF Candles
Multi Timeframe Candle drawing. Draw Any candles from any timeframe on your chart :-)