
Description
If the market keeps moving in this new direction, at some point the profit from the opposite-direction trade will overtake the loss from the initial trade, at which point you can close both trades.
If the market returns to the previous direction, the opposing trade with the bigger lot size will accumulate losses faster than the initial trade is gaining. In this situation, we open another trade in the initial direction by which the initial trade and the third trade together will be bigger than the second trade.
This back-and-forth hedging strategy can be continued until the price action breaks in either direction.
How to use the Zone Recovery Indicator
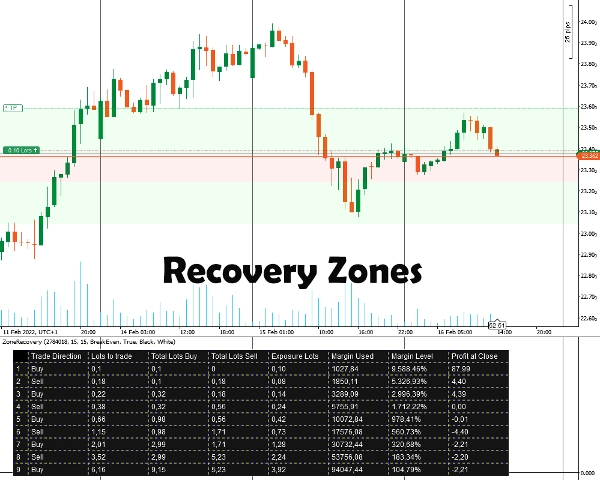
First, you have to enter the Position ID that you want to hedge for. The position must have a profit target. After that, you select the Zone Recovery size by entering the number of pips that you believe you must start hedging for. The indicator will display the zones as well as the table for the strategy to work.
You will have to manually place the orders, stop loss and take profit targets for all the subsequent positions.
Important Information
First and foremost, your trading account must be a hedging type account.
- At its core, this is a martingale strategy that comes with its risks. If the initial trade is opened in a ranging market, this can quickly drain your margin. You need volatile/trending instruments for better results.
- Trading instruments with low commissions/small spreads will work better.
- If the initial trade is done with the minimum lot size, the subsequent calculations will be marginally wrong, due to wrong commission calculations and rounded up/down lot sizes for future trades.
- If you trade an instrument that is different from your account’s currency, the margin calculation will be slightly off due to exchange rates constantly changing. (For example, account in EUR, open position in GBP/USD)
- Swaps are not taken into consideration.
Indicator Options
The indicator offers the options below:
- Position ID - The open position ID that you want to calculate the hedging table for. It can be entered without the initial “PID” (just the numbers).
- Zone Recovery Pips - The number of pips that the zone recovery will take into consideration for the calculations. At the end of the zone recovery, the trades of the opposing direction to the initial trade must be opened.
- Calculation Mode
Two modes are available: BreakEven and Profit
BreakEven: The calculations will attempt to give you lot sizes in order to have zero or minimal losses when all trades are closed. Slower margin drain.
Profit: The calculations will attempt to give you lot sizes in order to have the profit target of the initial open trade. Faster margin drain. - Draw Zone Recovery Areas - Choose yes if you want to have the Zone Recovery areas drawn on the Chart.
- Table Color / Font Color - Coloring options for the hedging table.
Summary
Customer reviews
5 | 100 % | |
4 | 0 % | |
3 | 0 % | |
2 | 0 % | |
1 | 0 % |


