Brokers & props
For business
00
Days
:
00
Hours
:
00
Minutes
:
00
Seconds
calculateSpreads_withSourceCode
"calculateSpreads_withSourceCode" logo
Since 27/02/2025
Free installs
162
"calculateSpreads_withSourceCode" uploaded image

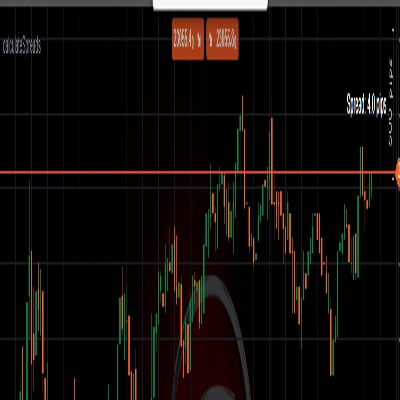
Indicator calculates spread in pips

5.0
Reviews: 1
5
100 %
4
0 %
3
0 %
2
0 %
1
0 %
Customer reviews
August 18, 2025
Real-time spread monitoring, customizable, open-source for modification. Cons: No history chart, no alerts, limited analytics.
You may also like
Donchian Flux Cloud
Trend-coloring Donchian cloud that highlights volatility squeezes and breakouts.
Indicator
NAS100
Indices
XAUUSD
+7
T3 Moving Average
A next‑generation moving average designed to deliver exceptional smoothness with minimal lag.
Indicator
Scalping
Nadaraya-Watson Kernel Regression
Ultra-smooth adaptive trend line via Gaussian kernel regression — low lag, clean structure.
Indicator
NAS100
XAUUSD
Forex
+3
Multiple Non-Linear Regression
This indicator is designed to perform multiple non-linear regression analysis using four independent variables.
Indicator
NAS100
NZDUSD
XAUUSD
+11
WT - RR Tool
Lightweight Risk-Reward Visualization Tool.
Indicator
NAS100
NZDUSD
Martingale
+26
Volume Delta
Read aggressive flow in real time. Flexible resets (Day/Week/Month), optional EMA smoothing, and non-repainting cumulati
Indicator
Forex
Signal
USDJPY
Yen Strength - Line Momentum
Single-line JPY Strength Indicator: Track yen momentum swiftly across key pairs—achieve clarity in your forex trades!
Indicator
Indices
E7 BlackScholes Model
Option pricing using the BlackScholes model and the Math.Numerics packages
Indicator
RSI
Breakout
XAUUSD
+6
Volume POC Heatmap
📊 Shows volume by price levels, highlights POC, and key zones. Identifies dynamic support/resistance and imbalances.
Indicator
FVG
ATR
FVG_OrderBlock
FVG Order Blocks Pro - Institutional-grade Fair Value Gap detection with smart order block analysis.
VolumeRenkoRange
Volume for Renko/Range
VegaXLR - RSI and StochRSI Alerts
VegaXLR's cTrader StochRSI identifies overbought/oversold RSI levels for precise trade entries.
KANDIKA HEAT MAP
Color-Based Market Pressure & Volatility Visualizer The Kandika Heatmap Indicator
Indicator
Indices
Breakout
Commodities
+3
Trend Lines Auto - FXMaster
Auto Trend Line Indicator for cTrader
Indicator
Indices
Prop
Stocks
+3
VegaXLR - Unlimited Trendline Alerts
This is an indicator that can alert you about trendlines, horizontal lines and vertical lines.
VegaXLR - cTrader Multi-Timeframe Pivot Pro
Customizable multi-timeframe pivot point indicator for cTrader with alerts, Fibonacci, CPR, and more!
Indicator
Indices
Stocks
Commodities
+2
DayOfWeek - FXMaster
Day of Week Indicator for cTrader
Indicator
Indices
Breakout
XAUUSD
+5
VQTX 2026 ULTRA
🚀 VQTX Indicator - The Ultimate Volatility & Trend Analysis Tool 🚀