
Description
🌐 DOMINATE THE MARKET WITH INSTITUTIONAL FLOW READING
What it shows: actual executed trades — real flow of aggression.
Advantages: This indicator is represented by tick data.
Represents money that has already been committed in the market.
Classifies aggressors (buyer/seller hits the ask/bid).
Detects absorption, exhaustion, acceleration of flow.
📈Combine with the free indicators, volume at price, volume squeezer.
https://ctrader.com/products/2514 https://ctrader.com/products/2874
Order Flow
Tape Reading
Ladder DOM
Institutional Absorption
Intelligent Breakouts
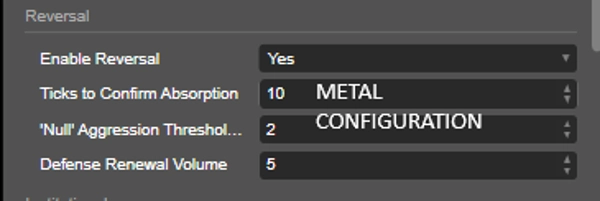
Flow Reversals
Buying and Selling Pressure
Real-Time Aggression Analysis
The system transforms the traditional chart into a true institutional market reading hub.
DIFFERENTIAL OF THE ALGORITHM
While common indicators only analyze candlesticks, Tape Reading Scalper interprets:
✅ Real aggression from buyers and sellers
✅ Flow speed
✅ Institutional defense
✅ Order absorption
✅ Ladder acceleration
✅ Breakouts confirmed by flow
✅ Reversals by exhaustion
✅ Institutional vs. retail pressure
✅ Intelligent lot scaling
SYSTEM STRUCTURE
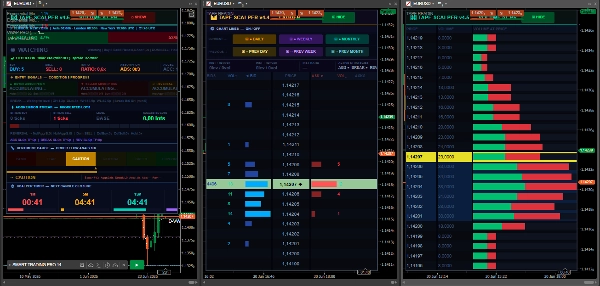
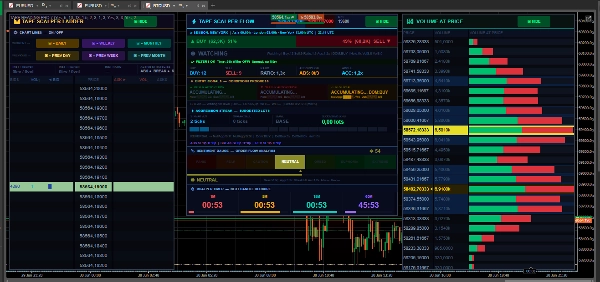
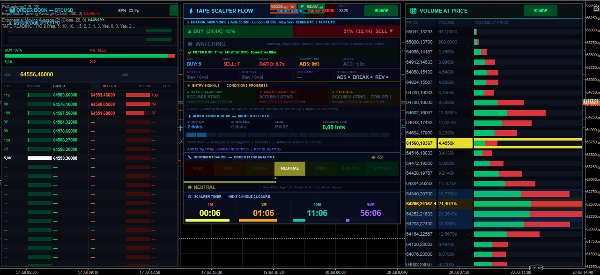
The algorithm has 2 independent professional panels:
⚡ FLOW PANEL (WINDOW 1)
Panel responsible for operational reading and signal generation.
Displays:
Buyer/Seller Flow
Absorption
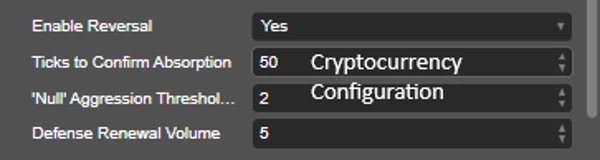
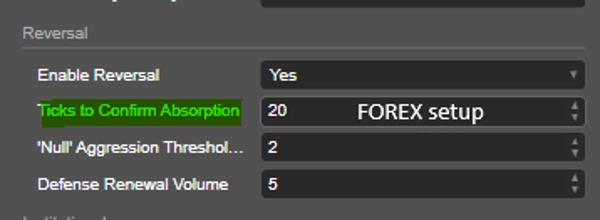
Reversal
Breakout
Aggression Streak
Market Sessions
Buy/Sell Ratio
Ladder Acceleration
Dynamic SL/TP
Operational Filters
📊 LADDER PANEL (WINDOW 2)
Institutional panel focused on:
DOM Ladder
Institutional Levels
Volume by Price
Institutional Pressure
POC
Range
Daily and Weekly High/Low
Price Book
Institutional Heat
EXPLANATION OF LADDER FUNCTIONS
1. BUY AGGRESSION
Shows current buyer aggression.
When it increases rapidly:
Buyers are entering strongly. Market may accelerate upwards. Indicates a possible breakout.
The higher the number:
➡ greater buying pressure.
2. SELL AGGRESSION
Shows seller aggression.
When it grows rapidly:
Sellers dominating
Possible continuation of the fall
Institutional short entry
3. BUY/SELL RATIO
Shows the relationship between buyers and sellers.
Example:
Ratio 2.0x = buyers dominate
Ratio 3.0x = strong institutional pressure
Ratio below 1.0 = sellers dominating
Interpretation:
Ratio Interpretation
1.0 Equilibrium
1.5 Moderate pressure
2.0+ Strong trend
3.0+ Strong institutional flow
4. ABSORPTION
One of the most powerful functions of the algorithm.
The system detects when:
There is a large aggressive volume
But the price is NOT moving
This means:
➡ Institutional investors absorbing orders.
BUYER ABSORPTION
The market receives a lot of selling, but:
The price stops falling. Institutional defense emerges. Possible reversal to buying.
Signal:
▲ BUYER ABSORPTION
SELLER ABSORPTION
The market receives a lot of buying, but:
The price doesn't rise. Sellers hold back the movement. Possible reversal to selling.
Signal:
▼ SELLER ABSORPTION
5. LADDER ACCELERATION
Measures the speed of flow in the DOM.
The algorithm compares:
Recent flow
vs. Previous flow
When it accelerates:
➡ Probable institutional entry.
Example:
Value Meaning
1.0x Normal flow
1.5x Strong acceleration
2.0x+ Institutional explosion
6. BREAKOUT DETECTION
Detects real breakouts.
The system validates:
✅ Volume
✅ Aggression
✅ Speed
✅ Streak
✅ Institutional Flow
✅ Ladder Acceleration
BREAKOUT BUY
Conditions:
Strong buying aggression Ladder accelerating Institutional pressure Breakout of the high
Result:
➡ Validated buy entry.
BREAKOUT SELL
Conditions:
Strong selling pressure Selling institutional flow Support breakout
Result:
➡ Sale confirmed.
7. REVERSAL DETECTION
Detects reversals due to exhaustion.
The system identifies:
Aggression disappearing Institutional defense emerging Loss of trend strength
Result:
➡ Anticipated reversal.
8. STREAK SYSTEM
Intelligent flow continuity system.
Counts how many consecutive ticks occurred:
Continuous Buy
or
Continuous Sell
STREAK LEVELS
Level Meaning
Level 1 Initial Trend
Level 2 Strong Flow
Level 3 Explosive Movement
9. SUGGESTED LOTS
The algorithm automatically suggests:
increased lot size
reduced risk
operational scale
Based on:
✅ Flow Strength
✅ Continuity
✅ Institutional Intensit
11. POC (POINT OF CONTROL)
Shows the price with the highest trading volume.
Importance:
Strong support/resistance
Institutional zone
Defense region
12. DAILY/WEEKLY LEVELS
Automatic lines for:
Daily high
Daily low
Weekly high
Weekly low
Used for:
✅ Breakouts
✅ Reversals
✅ Liquidity
✅ Stop-loss orders
13. INSTITUTIONAL FILTER
Advanced institutional filter.
Difference:
Retail Flow
vs Institutional Flow
The system validates:
✅ Institutional Clusters
✅ Volume per Level
✅ Dominant Pressure
📈Use this indicator as confirmation for entry into your strategy. It's worth highlighting the importance of analyzing the flow, absorption signals, tape speed, and aggression in ticks, as well as sentiment.
Summary
Key functionalities include detection of institutional absorption (when large volume does not move price), breakout validation through volume and flow speed, reversal anticipation by exhaustion signals, and an intelligent streak system counting consecutive buy or sell ticks. The indicator also suggests lot sizing based on flow strength and institutional intensity, and applies an institutional filter distinguishing retail versus institutional flow.
Tape Reading 4.2 supports analysis of key market levels, real-time aggression, and flow reversals, transforming traditional charts into comprehensive institutional market reading tools. It is suitable for traders seeking detailed order flow insights and confirmation signals for entries based on market microstructure and volume dynamics.
Customer reviews
5 | 50 % | |
4 | 50 % | |
3 | 0 % | |
2 | 0 % | |
1 | 0 % |


!["Smart Money Concepts (SMC) [Iridio Capital]" logo](https://cdn.ctrader.com/image/webp/28b69fd1-ef54-4bed-9487-07e78e883be4_40934)


