"PVA Volume+Analysis_noSourceCode" logo
PVA Volume+Analysis_noSourceCode
5.0
Reviews: 3
"PVA Volume+Analysis_noSourceCode" uploaded image
86
Sales
5.26K
Free installs

PVA (Price-Volume Analysis) is a technical analysis approach that studies the relationship between the price and trading volume of a financial asset. The core idea behind PVA is that trading volume can provide important information about the strength and direction of a trend, helping traders make more informed decisions.

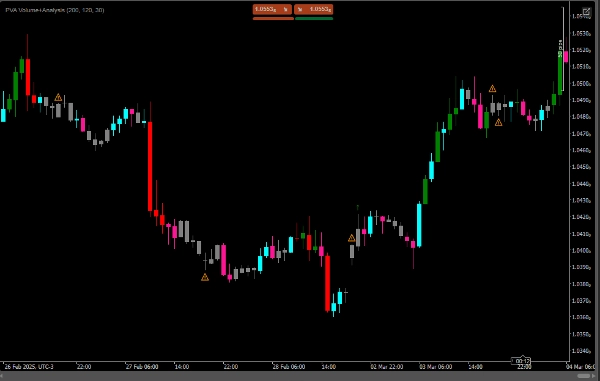
-Increasing volume with rising price: Indicates a strong uptrend, and a green symbol (up arrow) is displayed.

-Increasing volume with falling price: Indicates a strong downtrend, and a red symbol (down arrow) is displayed.

-Decreasing volume with rising price: Indicates that the uptrend may be losing strength, and an orange alert (warning symbol) is displayed.

-Decreasing volume with falling price: Indicates that the downtrend may be losing strength, and an orange alert (warning symbol) is also displayed.

-If the volume is falling in an upward or downward movement, an alert mark (⚠️) is drawn.


Indicator profile
5.0
Reviews: 3
5
100 %
4
0 %
3
0 %
2
0 %
1
0 %
Customer reviews
January 28, 2026
August 12, 2025
Pros: Detailed price-volume analysis, highlights high-activity zones, useful for VSA trading. Cons: No alerts, no MTF mode, can be resource-heavy with large history. Requires experience to interpret.
May 13, 2025
Products available through cTrader Store, including trading bots, indicators and plugins, are provided by third-party developers and made available for informational and technical access purposes only. cTrader Store is not a broker and does not provide investment advice, personal recommendations or any guarantee of future performance.

More from this author

Order BlockIndicator reversal
Precision Scalper,XAUUSD ,Averages that functions like a multidimensional radar:
34.8%
2.12
Profit factor
5%
Max drawdown
Intelligent negotiations and analysis!
47.3%
3
Profit factor
2%
Max drawdown
Intelligent system, Available any instrument. Profit 12. Drawdown 1%
Volume Profile Price Period and Live VAH,VAL,POC,
Chart Patterns Algo Bot
Profitable low-risk robot, ROI 32% month, live,
36.8%
3.4
Profit factor
7%
Max drawdown
INDICATOR,LIQUIDITY POOLS,ACCURATE SIGNAL, NO DELAY,80% PROBABILITY
Indicator,combines with several strategies.MA locate trends,pullback, signal volumes, reversals, support and resistance
Trend analysis, automatic analysis, position, swingtrader, scalper
BoS ChoCH Pro,Strict Mode,False Breakout Filter,Average hit rate: 72-78%
POSITION 5000 Pips: The Ultimate Algorithm for Gold
16.8%
4
Profit factor
5%
Max drawdown

You may also like

Binary Options Signals Pro – Precision Trading at Your Fingertips
Buy at green arrow if trend is bullish and viceversa
Ultra-Flexible VWAP Indicator with Advanced Customization
High-Performance Renko Chart Indicator with Advanced AI Filtering
VolumeProfileSuite is an advanced and flexible Volume Profile indicator for cTrader.
The EMA Trend Simple is a trend-following tool designed for simplicity and visual clarity.
DXY Valuation Zones
Chart Explanation — Pivot High & Pivot Low Visualization and Dynamic Guidance
This technical analysis indicator provides information on market sentiment, trend and price levels....
Automatically detects and marks higher highs, lower highs, lower lows and higher lows.Check the other version in my page
Shows bars from different Time Frame on zoom out and hides the current bars. Perfect tool for Multi TF "Market Reply"
🚨Detection of geometric price patterns (Harmonic Patterns) and market structures based on price action📈
It calculates Anchored VWAP and StdDev bands from a user-defined start date for cTrader charts.
Get the exact SuperTrend experience from TV, now perfectly rebuilt for cTrader
REAL Supertrend because default Ctrader Supertrend gives different signals
Detects Head & Shoulders patterns, plots signals, and alerts for trading opportunities.
Laguerre RSI is based on John EHLERS' Laguerre Filter to avoid the noise of RSI.
3 bar triangle = high below 2 day high, low above 2 day low
86
Sales
5.26K
Free installs