
Description
Fair Value Gap indicator
Overview
The Fair Value Gap indicator is a precision tool for price-action traders who want to identify, track and validate short-term market imbalances. It automatically detects bullish and bearish Fair Value Gaps (FVGs), highlights active (unmitigated) zones on your chart, and records when price later fills (mitigates) those zones. Lightweight and non-repainting (operates on closed bars), this indicator is designed for reliable analysis in live trading and backtesting.
Key Features
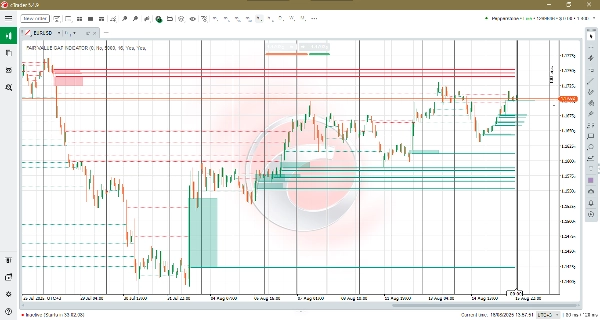
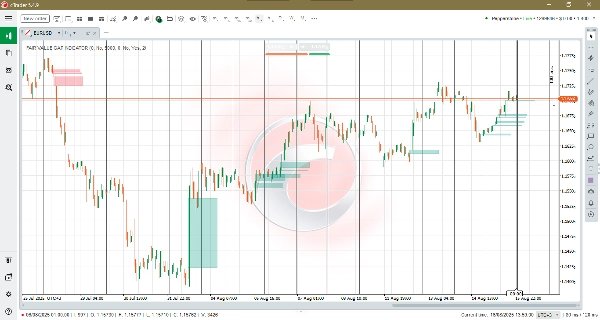
- Automated FVG Detection: Robust 3-bar logic identifies both bullish and bearish imbalance zones and plots clean rectangular zones on the chart.
- Mitigation Tracking: When price closes through a zone the indicator removes the box and can draw a persistent dotted mitigation line for historical reference.
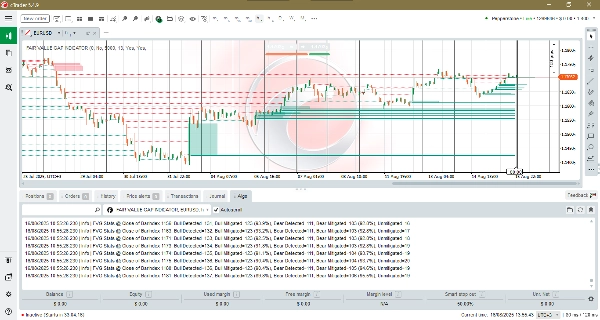
- Unmitigated Level Overlay: Shows the N most recent unfilled levels as bold horizontal lines drawn from the bar of detection to the currently forming bar. This makes it easy to visually scan active (unmitigated) Fair Value Gaps and quickly identify their price levels.
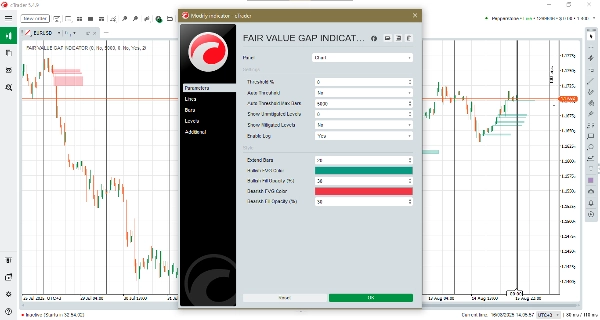
- Manual & Auto Thresholding: Choose a fixed relative threshold or enable Auto Threshold to let the indicator adapt to recent market activity.
- Auto Threshold Max Bars: Controls the sliding-window size used to compute the automatic threshold. Larger values smooth the threshold (stable over longer history); smaller values make it more responsive to recent volatility.
- Custom Visuals & Projection: Set extend length (how far boxes project), color and fill opacity for bullish and bearish zones to match your chart style.
- Terminal Logging: Compact log lines report total FVGs detected, mitigations and current unmitigated counts—ideal for validation and strategy tuning.
- Closed-Bar Logic: Designed to run once per closed bar to minimize repainting.
Benefits
- Clear trade references: Quickly find imbalance zones that may act as return targets, reaction areas, or trade management references.
- Validation & statistics: Use terminal logs and mitigation percentages to validate signals and tune sensitivity for your strategy.
- Adaptable sensitivity: Auto Threshold + Max Bars lets the indicator behave reliably across quiet and volatile markets without constant manual retuning.
- Compact & non-intrusive visuals: Minimal visual footprint keeps your charts readable while preserving essential context.
Ideal For
Day traders, swing traders and scalpers who rely on price-action and imbalance concepts, plus analysts validating order-flow reactions and strategy performance.
Conclusion
Fair Value Gap indicator combines precise imbalance detection with mitigation analytics and adaptive thresholding, giving you a focused, low-noise view of market imbalances. Use it to spot potential price returns, manage trades more intelligently, and measure how frequently zones are being filled in your market.
Summary
Key features include automated FVG detection, mitigation tracking, and an overlay showing recent unmitigated levels as bold horizontal lines for easy visual scanning. Users can select manual or automatic thresholding to adapt sensitivity to market conditions, with adjustable parameters controlling the responsiveness of the auto threshold. Customizable visual settings allow traders to tailor the appearance of bullish and bearish zones.
The indicator operates on closed bars to minimize repainting, ensuring reliable signals for live trading and backtesting. Terminal logging provides concise statistics on detected gaps and mitigations, aiding validation and strategy tuning.
Suitable for day traders, swing traders, scalpers, and analysts, the Fair Value Gap Indicator supports markets including Forex, indices, commodities, cryptocurrencies, and stocks. It offers a focused, low-noise view of market imbalances to assist in identifying potential price return targets and managing trades.
Customer reviews
5 | 100 % | |
4 | 0 % | |
3 | 0 % | |
2 | 0 % | |
1 | 0 % |


