
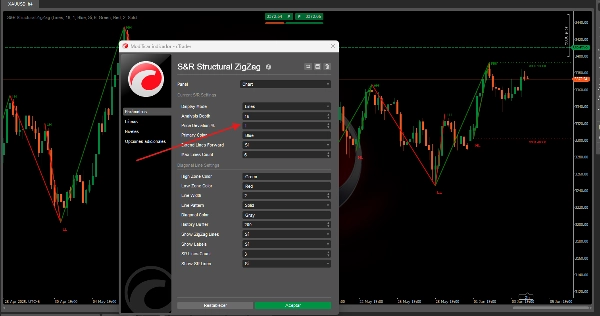
S&R Structural ZigZag
Indicator
519 downloads
Version 1.0, Jun 2025
Windows, Mac
5.0
Reviews: 1
Pinescriptlabs Store indicators: 🤖Pinescriptlabs Store cBots : (cBot)
PRICE ACTION (New)
Gold & BTC BreakoutSession Pivots(new)
SmartTrend Support &
Resistance
Lines
Dynamic
Market Structure
Analysis
of
Turning Points
Fibonacci
Linear
Regression
Multi-timeframe
Auto
Support and
Resistance
Trend
Lines
All
Support and
Resistance
Levels
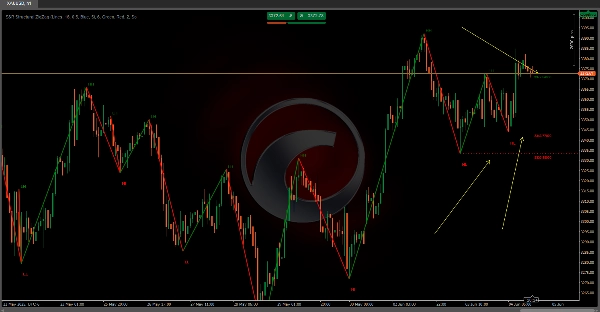
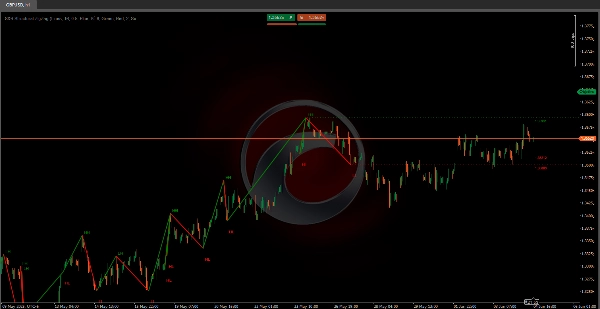
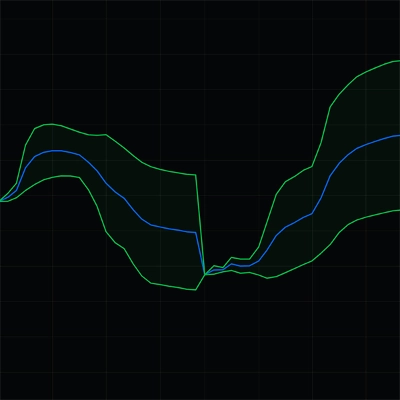
Zig Zag Support & Resistance with Swings
1. What Does This Indicator Do? ❓
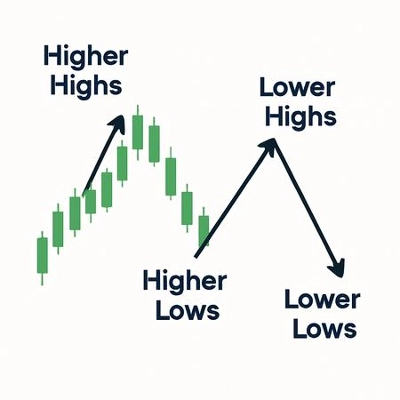
🔍 Detects Price Swings (Highs & Lows)
- Scans recent bars ("Analysis Depth") to find the highest/lowest price in that range.
- Validates swings with a % threshold (e.g., 1%+ change vs. last swing) → Marks new ✅ Swing Highs/Lows.
- Reduces noise ⚡: Only confirms swings if half the analysis period passes without a higher high/lower low.
📉 Draws Zigzag Trendlines
- Connects swings with dynamic lines:
- 🟢 Green = Uptrend (new swing > prior).
- 🔴 Red = Downtrend (new swing < prior).
⏹️ Highlights Key Levels
- Support/Resistance Lines: Drawn at each swing’s exact price, extended rightward
- Labels show price values 📌 (e.g., "1.1050") for instant analysis.
🚦 Reveals Market Structure
- Identifies trends at a glance:
- Bullish = Higher Highs (HH) + Higher Lows (HL).
- Bearish = Lower Highs (LH) + Lower Lows (LL).
2. How to Use It (Setup Guide) ⚙️
Install on cTrader: Drag & drop onto your chart!
Key Settings:
- Analysis Depth 🔎:
10(default) → Higher values filter noise; lower values catch more swings. - Price Deviation % 📏:
1.0%(adjustable) → Min. price change to validate swings. - Swing Labels 🏷️ (HH/HL/LH/LL): Toggle On/Off.
- Extend Lines ➡️: Project S/R levels infinitely or limit to current bars.
Indicator profile
5.0
Reviews: 1
5 | 100 % | |
4 | 0 % | |
3 | 0 % | |
2 | 0 % | |
1 | 0 % |
Customer reviews
August 18, 2025
Clear structural support/resistance mapping, customizable, lightweight. Cons: No auto-labels, no historical level tracking, no alerts.
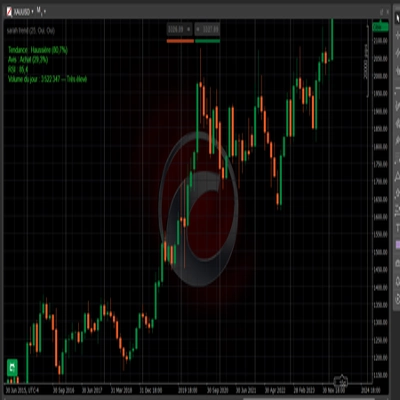
BTCUSD
Breakout
Supertrend
Commodities
RSI
Crypto
XAUUSD
Products available through cTrader Store, including trading bots, indicators and plugins, are provided by third-party developers and made available for informational and technical access purposes only. cTrader Store is not a broker and does not provide investment advice, personal recommendations or any guarantee of future performance.


Since 03/10/2024
144
Sales
32.74K
Free installs