Brokers & props
For business
00
Days
:
00
Hours
:
00
Minutes
:
00
Seconds
Insider_CumulativeDelta
"Insider_CumulativeDelta" logo
Since 09/01/2025
Free installs
6312
"Insider_CumulativeDelta" uploaded image"Insider_CumulativeDelta" uploaded image

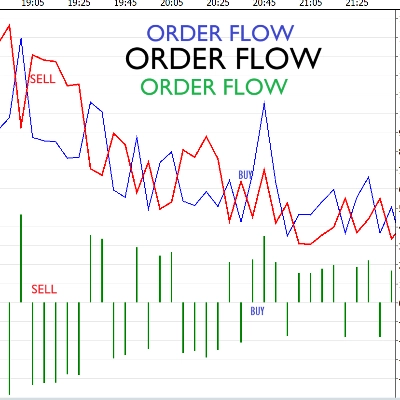
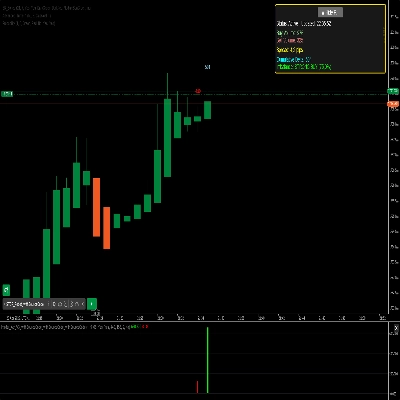
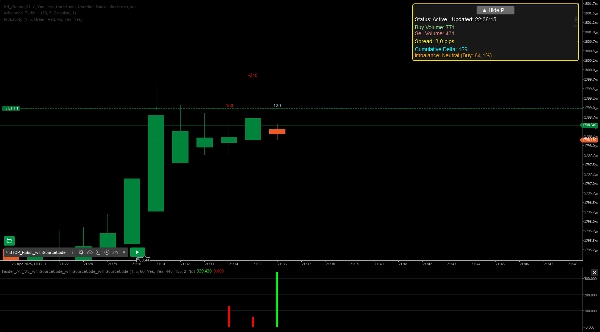
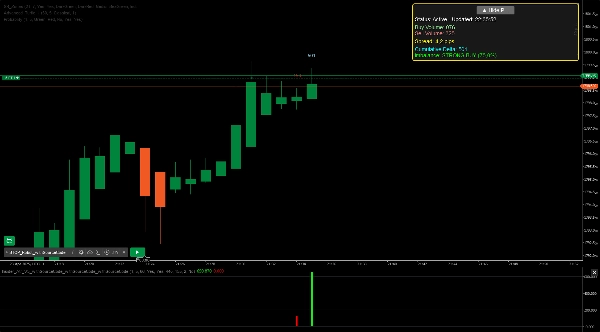
Robust Cumulative delta and imbalance indicator.

Insider is a robust cTrader indicator designed to analyze market depth data and highlight buy and sell imbalances in real time. It provides clear visual feedback on the chart, displaying key metrics like buy/sell volume, cumulative delta, and imbalance strength through histograms and a customizable dashboard. Tailor it to your trading style with adjustable settings, including display period, depth levels (1-10), and volume imbalance threshold (50-95%). Additional features include optional alerts for strong imbalances, trading hours filtering, and a resizable panel for enhanced usability. Ideal for day traders and swing traders, this indicator offers valuable insights into market sentiment and potential price movements.

5.0
Reviews: 1
5
100 %
4
0 %
3
0 %
2
0 %
1
0 %
Customer reviews
August 12, 2025
Pros: Accurate order flow insight, customizable display, valuable for intraday trading. Cons: No alerts, requires experience to interpret, no MTF mode.
More from this author
Cumulative Delta Candles + VolumeProfile
Cumulative delta candles + volume profile
Support Resistance Zones
Support and Resistance.
VolumeProfile_8
Scalpers Volume Profile
DynamicVolumeSupplyDemand
Supply and Demand Zones
Indicator
Grid
NAS100
NZDUSD
+17
Institutional Volume Supply Demand
Volume Profile Supply Demand
Tape reader
TAPE READER :-)
Indicator
NAS100
NZDUSD
XAUUSD
+13
ORDERFLOW_SKIA_Plynuly
This Indicator will show you Direction, Distance, and Time;
Indicator
Breakout
BreakOut_Probability_Expo
Break Out Probability Experimental indicator. Credits for this indicator goes to Zeiierman !!!
MTF Candles
Multi Timeframe Candle drawing. Draw Any candles from any timeframe on your chart :-)
Cumulative Delta_noSourceCode
Demo of my main indcator.
You may also like
Indicator
Martingale
Forex
Fibonacci
+24
Smart Floating Risk-Utimate version
📊 Smart Floating Risk Ultimate.Transform Your Risk Management with Real-Time Intelligence.
Forex Market Color
A single color for each session.
Indicator
NAS100
NZDUSD
Breakout
+18
Volatility Weighted Cloud by LudwigICT
Volatility-weighted cloud with adaptive bands and UP/DOWN tags for timing trends, pullbacks, and breakouts.
Indicator
Grid
RSI
Breakout
+6
Final Stochastic Oscillator
Final Stochastic Oscillator is a next-generation upgrade of the classic stochastic indicator
Indicator
Indices
Commodities
Forex
Institutional FVG Zones MTF with Confluence
Professional Fair Value Gaps with multitimeframe spot on
Indicator
Grid
NAS100
RSI
+21
Market Cipher B
Market Cipher B
E7 Volume Profile
E7 Volume Profile, more modern look and feel.
Order Block Finder
Order Block Detector is built to spot and display Order Blocks on chart, often triggering strong price reactions.
Indicator
Indices
Breakout
Commodities
+3
Daily Levels
The "Daily Levels" indicator is used to display last week's and yestoday high/low price
IR Moving Average
 this moving include everything that a trader needs from Moving Average.
Indicator
NAS100
Indices
XAUUSD
+4
PrevDayProjection
Automatically calculates the previous day’s high and low, determines the range, and then projects Fibonacci levels.
VWAP Tokyo Open
VWAP Set to Tokyo Open
LT Flexible Volume Profile
Flexible Volume Profile, designed with performance in mind.
HeatMap Candle
HeatMap Candle
Indicator
RSI
XAUUSD
Breakout
+4
S&R Structural ZigZag
"Detects swings 🎯, draws zigzag trends 📈📉, support/resistance ⏹️, labels HH/HL/LH/LL, Tracks market structure 🚀🐻."
Market BIAS Detector
The Market BIAS Detector is a smart trading assistant designed to identify the market.
Indicator
Stocks
Commodities
Forex
buy sell
SmartSignal Pro: Precise BUY/SELL signals to profit in any market. Trade like a pro! 🚀
Indicator
RSI
Breakout
Supertrend
All Support and Resistance Levels
"Identify key market zones and visualize support/resistance from multiple timeframes on a single chart.