Penerangan
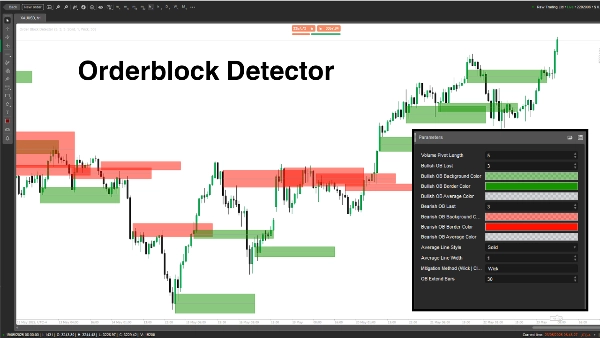
Penunjuk "Order Block Detector" dibina untuk mengesan dan memaparkan Order Blocks (OBs) pada carta harga—zon utama di mana pemain besar (institusi) meletakkan pesanan beli atau jual yang signifikan, sering mencetuskan reaksi harga yang kuat. Ia membantu pedagang mengenal pasti potensi zon sokongan/rintangan untuk kemasukan perdagangan yang lebih bijak, stop-loss, atau ambil untung.
Konsep
- Order Blocks: Ini adalah zon harga di mana pasaran berbalik atau berhenti kerana aliran pesanan institusi yang berat. Penunjuk mengesan OB dengan menganalisis puncak pivot volum dan keadaan pasaran (bullish/bearish).
- Bagaimana ia berfungsi:
-
- Menentukan keadaan pasaran (bullish/bearish) dengan membandingkan tinggi/rendah kepada tempoh semakan semula (Length).
- Mengenal pasti OB pada puncak volum yang berkaitan dengan tahap harga utama.
- Melukis segi empat tepat dan garis purata untuk menandakan OB, sambil memeriksa dan mengeluarkan OB yang diatasi apabila harga menembusi.
- Kes penggunaan: Pedagang boleh menggunakan OB sebagai zon kebarangkalian tinggi untuk penyediaan perdagangan, pengurusan risiko, atau sasaran keuntungan.
Perincian Parameter
- Panjang Pivot Volum (Length, Default: 5, Min: 1)
-
- Apa yang dilakukannya: Menetapkan tempoh semakan semula (bilangan bar) untuk mengira tinggi/rendah dan puncak pivot volum.
- Mengapa ia penting: Panjang yang lebih lama meningkatkan ketepatan tetapi mengurangkan kekerapan OB; panjang yang lebih pendek menangkap lebih banyak OB tetapi mungkin termasuk gangguan.
- OB Bullish Terakhir (BullExtLast, Default: 3, Min: 1)
-
- Apa yang dilakukannya: Mengehadkan bilangan OB bullish yang disimpan dan dijejak.
- Mengapa ia penting: Mengehadkan bilangan OB bullish yang dipaparkan untuk memastikan carta bersih dan mengoptimumkan prestasi.
- Warna Latar Belakang OB Bullish (BgBullCss, Default: #80169400)
-
- Apa yang dilakukannya: Menetapkan warna latar belakang dan ketelusan segi empat tepat OB bullish.
- Mengapa ia penting: Membantu membezakan OB bullish secara visual pada carta.
- Warna Sempadan OB Bullish (BullCss, Default: #169400)
-
- Apa yang dilakukannya: Menentukan warna sempadan segi empat tepat OB bullish.
- Mengapa ia penting: Meningkatkan keterlihatan zon OB bullish.
- Warna Purata OB Bullish (BullAvgCss, Default: #609598A1)
-
- Apa yang dilakukannya: Memberi warna pada garis purata dalam OB bullish.
- Mengapa ia penting: Menandakan titik tengah OB, berfungsi sebagai tahap rujukan utama untuk pedagang.
- OB Bearish Terakhir (BearExtLast, Default: 3, Min: 1)
-
- Apa yang dilakukannya: Mengehadkan bilangan OB bearish yang disimpan dan dijejak.
- Mengapa ia penting: Seperti BullExtLast, memastikan carta tidak sesak dengan mengehadkan OB bearish.
- Warna Latar Belakang OB Bearish (BgBearCss, Default: #80FF1100)
-
- Apa yang dilakukannya: Menetapkan warna latar belakang dan ketelusan segi empat tepat OB bearish.
- Mengapa ia penting: Membezakan OB bearish daripada yang bullish.
- Warna Sempadan OB Bearish (BearCss, Default: #FF1100)
-
- Apa yang dilakukannya: Menentukan warna sempadan segi empat tepat OB bearish.
- Mengapa ia penting: Membuat OB bearish menonjol untuk pengenalan cepat.
- Warna Purata OB Bearish (BearAvgCss, Default: #609598A1)
-
- Apa yang dilakukannya: Memberi warna pada garis purata dalam OB bearish.
- Mengapa ia penting: Menonjolkan tahap harga tengah OB bearish untuk perancangan perdagangan.
- Gaya Garis Purata (LineStyle, Default: Solid)
-
- Apa yang dilakukannya: Menetapkan gaya garis purata OB (Solid, Dashed, Dotted).
- Mengapa ia penting: Menyesuaikan rupa garis purata mengikut keutamaan pedagang.
- Lebar Garis Purata (LineWidth, Default: 1, Min: 1)
-
- Apa yang dilakukannya: Melaraskan ketebalan garis purata OB.
- Mengapa ia penting: Mengawal sejauh mana garis purata kelihatan menonjol pada carta.
- Kaedah Mitigasi (Mitigation, Default: "Wick")
-
- Apa yang dilakukannya: Menentukan bagaimana OB tidak sah:
-
- Wick: Menggunakan harga terendah (OB bullish) atau harga tertinggi (OB bearish) untuk memeriksa mitigasi.
- Close: Menggunakan harga penutupan untuk memeriksa mitigasi.
- Mengapa ia penting: Mempengaruhi sejauh mana penunjuk sensitif terhadap harga yang menembusi zon OB, memberi kesan bila OB dikeluarkan.
Order Block Detector adalah alat yang kuat untuk mengesan zon pesanan institusi berdasarkan lonjakan volum dan tindakan harga. Ia melukis segi empat tepat OB yang jelas dengan garis purata dan mengeluarkan yang tidak sah secara dinamik. Pedagang boleh melaraskan parameter untuk menyesuaikan pengesanan, paparan, dan pengurusan OB agar sesuai dengan gaya perdagangan mereka.
Ringkasan
The indicator works by analyzing volume pivot highs and determining market state (bullish or bearish) based on highs and lows over a configurable lookback period. It marks OBs with rectangles and average lines, dynamically removing those invalidated when price breaks through the zones. Users can customize parameters such as the lookback length, the number of bullish and bearish OBs tracked, colors and styles of OB rectangles and average lines, and the method used to detect OB mitigation (using wick or close prices).
This flexibility allows traders to tailor the detection and visualization of Order Blocks to their trading style, aiding in identifying high-probability zones for trade setups, risk management, and profit targeting.
Ulasan pelanggan
5 | 100 % | |
4 | 0 % | |
3 | 0 % | |
2 | 0 % | |
1 | 0 % |