
Bar Explosion
Indicator
206 downloads
Version 1.0, May 2025
Windows, Mac
Description
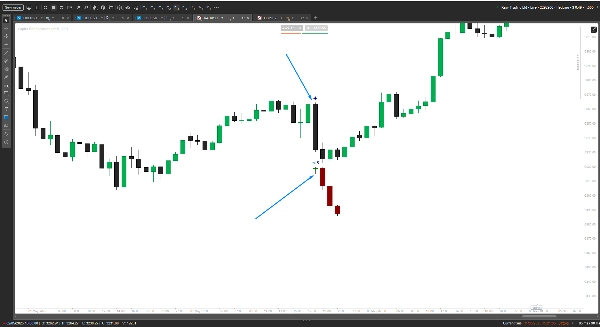
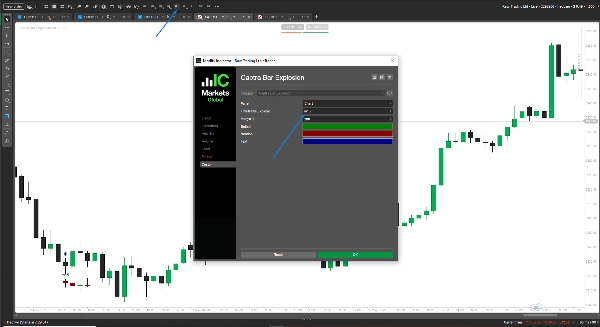
Unleash the power of Captra's Bars Explosion, a top-tier cTrader indicator designed to dominate your trading game. This beast overlays explosive mini-timeframe candlestick visuals, letting you spot trends with razor-sharp precision. Customize timeframe (e.g., Minute15), colors (Bullish/Green, Bearish/DarkRed), and margins (default 30 pips) to fit your style. Perfect for scalpers and swing traders, it’s built for cTrader with smooth performance.
Please leave a review to let us know if it’s helpful.
Summary
AI summary
Bar Explosion is a cTrader indicator that overlays mini-timeframe candlestick visuals onto your main chart, enabling precise trend identification. Users can customize the indicator’s timeframe (e.g., 15 minutes), colors for bullish (green) and bearish (dark red) bars, and margin settings (default 30 pips) to suit different trading styles. Designed for scalpers and swing traders, it provides detailed, smaller timeframe bar information directly on higher timeframe charts, enhancing market analysis without switching views. The indicator is optimized for smooth performance within the cTrader platform.
Indicator profile
Customer reviews
0.0
Reviews: 0
Customer reviews
No reviews for this product yet. Already tried it? Be the first to tell others!
Discussion
FAQ
Products available through cTrader Store, including trading bots, indicators and plugins, are provided by third-party developers and made available for informational and technical access purposes only. cTrader Store is not a broker and does not provide investment advice, personal recommendations or any guarantee of future performance.
More from this author


Price
86.62M
Traded volume
1.99M
Pips won
3.65K
Free installs