
Head Shoulders Finder
Indicator
448 downloads
Version 1.0, May 2025
Windows, Mac
5.0
Reviews: 1
Description
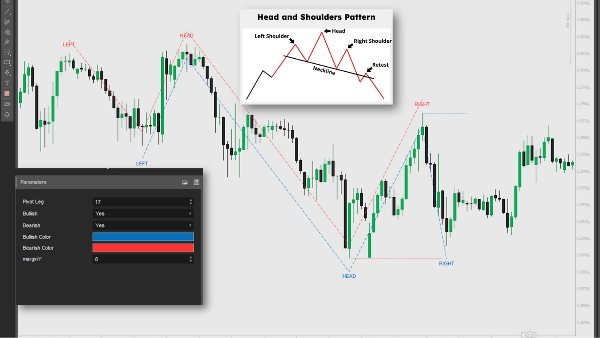
This indicator identifies Head and Shoulders and Inverted Head and Shoulders patterns by analyzing pivot highs and lows in price data. It plots lines, labels, and signals for potential trend reversals, triggering short conditions when the price crosses below the neckline (bearish) or long conditions when above (bullish). Traders can use these signals to enter short or long positions, combining with other analyses and risk management to optimize trading strategies.
Summary
AI summary
The Head Shoulders Finder is a technical indicator designed to detect Head and Shoulders and Inverted Head and Shoulders chart patterns by analyzing pivot highs and lows in price data. It visually marks these patterns with lines and labels on the price chart, highlighting potential trend reversal points. The indicator generates trading signals by identifying when the price crosses the neckline: a break below signals a bearish trend reversal suitable for short positions, while a break above indicates a bullish reversal for long positions. Traders can use these signals alongside other technical analyses and risk management strategies to inform entry decisions. This tool supports pattern recognition and signal plotting to assist in identifying potential trading opportunities based on classic reversal formations.
Indicator profile
Customer reviews
5.0
Reviews: 1
5 | 100 % | |
4 | 0 % | |
3 | 0 % | |
2 | 0 % | |
1 | 0 % |
Customer reviews
August 18, 2025
Automatically detects Head & Shoulders patterns, customizable visuals. Cons: No pattern reliability filter, no alerts, false signals on low TFs.
Discussion
FAQ
Products available through cTrader Store, including trading bots, indicators and plugins, are provided by third-party developers and made available for informational and technical access purposes only. cTrader Store is not a broker and does not provide investment advice, personal recommendations or any guarantee of future performance.
More from this author


Price
86.67M
Traded volume
1.99M
Pips won
3.66K
Free installs