
Compare Symbol
Indicator
199 downloads
Version 1.0, May 2025
Windows, Mac
Description
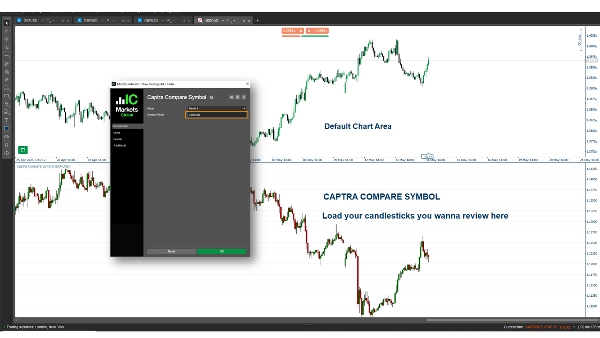
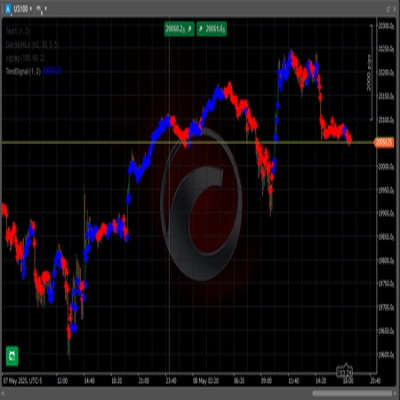
Captra Compare Symbol is a cTrader indicator that displays the close price and draws candlesticks (wick, body) for a selected symbol, like EURUSD, on the chart. It supports various timeframes (e.g., 5M, 15M, 1H, Daily) with customizable visuals, using open/close/high/low prices for accurate representation.
Summary
AI summary
Captra Compare Symbol is a cTrader indicator that visualizes price data of a selected trading symbol, such as EURUSD, directly on the chart. It plots the close price and renders candlesticks—including wicks and bodies—using open, high, low, and close prices for precise representation. The indicator supports multiple timeframes, including 5-minute, 15-minute, 1-hour, and daily intervals. Visual elements are customizable to fit user preferences. This tool enables traders to compare the price action of an additional symbol alongside their primary chart, facilitating multi-symbol analysis within the cTrader platform.
Indicator profile
Customer reviews
0.0
Reviews: 0
Customer reviews
No reviews for this product yet. Already tried it? Be the first to tell others!
Discussion
FAQ
EURUSD
Products available through cTrader Store, including trading bots, indicators and plugins, are provided by third-party developers and made available for informational and technical access purposes only. cTrader Store is not a broker and does not provide investment advice, personal recommendations or any guarantee of future performance.
More from this author


Price
86.67M
Traded volume
1.99M
Pips won
3.66K
Free installs