
High TF Plotter
Indicator
441 downloads
Version 1.0, May 2025
Windows, Mac
4.6
Reviews: 3
Description
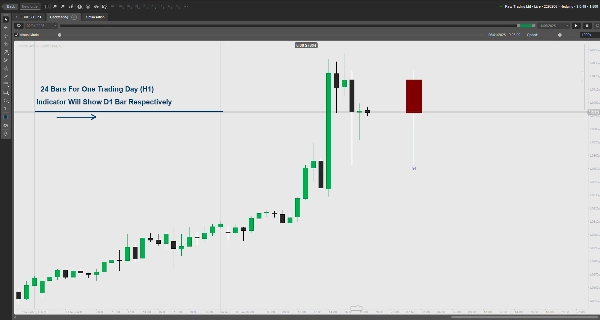
Plots high TF price action on lower TF charts. Shows open/close, wicks, and key zones with bull/bear colors. Customizable.
Key Features:
- Overlays high timeframe (e.g., Daily) price action on lower timeframe charts.
- Displays open/close price rectangles with customizable bull/bear colors.
- Highlights wick premium/discount zones for key price levels.
- Configurable margin for chart spacing.
- Error handling for invalid timeframe settings.
Please leave a review to let us know if it’s helpful.
Summary
AI summary
High TF Plotter is a trading indicator that overlays high timeframe price action onto lower timeframe charts. It visually represents open and close prices using customizable bull and bear colored rectangles. The tool highlights wick premium and discount zones to mark key price levels, aiding in the identification of significant market areas. Users can adjust chart spacing through a configurable margin setting. The indicator includes error handling for invalid timeframe inputs, ensuring reliable operation. This functionality supports analysis by combining broader timeframe context with detailed lower timeframe data.
Indicator profile
Customer reviews
4.6
Reviews: 3
5 | 67 % | |
4 | 33 % | |
3 | 0 % | |
2 | 0 % | |
1 | 0 % |
Customer reviews
January 27, 2026
It would have been very helpful if it were possible to configure the time for NY EST
August 18, 2025
Clear higher timeframe level plotting, customizable, lightweight. Cons: No auto-labels, no multi-timeframe overlays, no alerts.
May 29, 2025
Muito bom, mas se tivesse a linha de abertura, máxima e mínima seria perfeito. Obrigada.
Discussion
FAQ
Products available through cTrader Store, including trading bots, indicators and plugins, are provided by third-party developers and made available for informational and technical access purposes only. cTrader Store is not a broker and does not provide investment advice, personal recommendations or any guarantee of future performance.
More from this author


!["[Stellar Strategies] Ultimate Trend & Momentum Dashboard" logo](https://cdn.ctrader.com/image/webp/e9a9c9e9-4b6c-4bc0-9988-4c4768a23b6c_30290)


Price
86.62M
Traded volume
1.99M
Pips won
3.66K
Free installs