
Time Marker
Indicator
402 downloads
Version 1.0, May 2025
Windows, Mac
Description
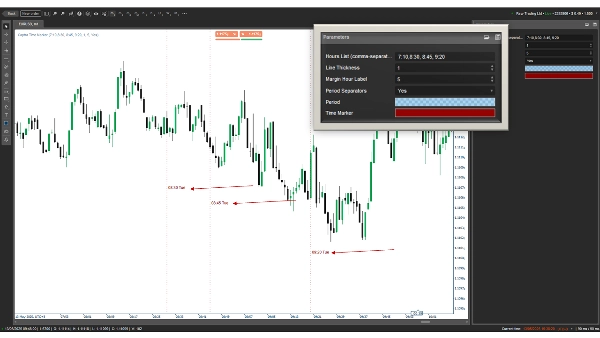
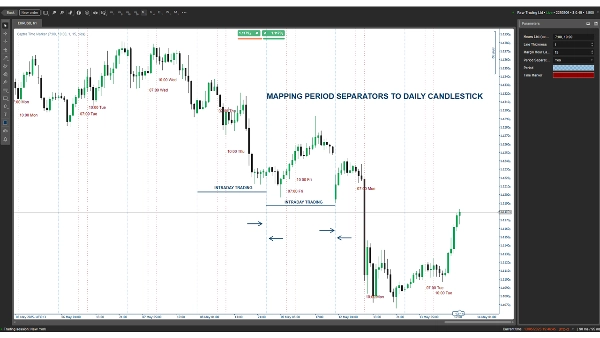
Captra Time Marker enhances your cTrader experience by visually marking user-defined times (e.g., 7:10, 8:30) with dashed vertical lines and labeled text (e.g., "07:10 Mon"). Ideal for traders focusing on specific market hours, it supports customizable time inputs, line thickness, and label positioning. Optional daily period separators highlight session starts, with configurable colors and styles. Perfect for scalpers, day traders, and those needing precise time-based analysis. Easy to set up, lightweight, and compatible with all timeframes.
Summary
AI summary
Time Marker is an indicator for cTrader that visually marks user-defined times on trading charts with dashed vertical lines and labeled text (e.g., "07:10 Mon"). It allows traders to specify exact times of interest, customize line thickness, and adjust label positioning. The indicator also offers optional daily period separators to highlight session starts, with configurable colors and styles. Designed for scalpers, day traders, and those requiring precise time-based analysis, it is lightweight, easy to set up, and compatible with all timeframes.
Indicator profile
Customer reviews
0.0
Reviews: 0
Customer reviews
No reviews for this product yet. Already tried it? Be the first to tell others!
Discussion
FAQ
Products available through cTrader Store, including trading bots, indicators and plugins, are provided by third-party developers and made available for informational and technical access purposes only. cTrader Store is not a broker and does not provide investment advice, personal recommendations or any guarantee of future performance.
More from this author


!["[Hamster-Coder] Pivot Points MTF" logo](https://cdn.ctrader.com/image/webp/4c143e5a-309c-40e3-a578-f04d1e133ffa_31159)


!["[Stellar Strategies] Inside Bar with Signals" logo](https://cdn.ctrader.com/image/webp/1d9e8bfa-3b2c-4440-bb37-5856902008a7_30683)


Price
86.67M
Traded volume
1.99M
Pips won
3.66K
Free installs