
Levels
Indicator
175 downloads
Version 1.0, Jan 2026
Windows, Mac

Description
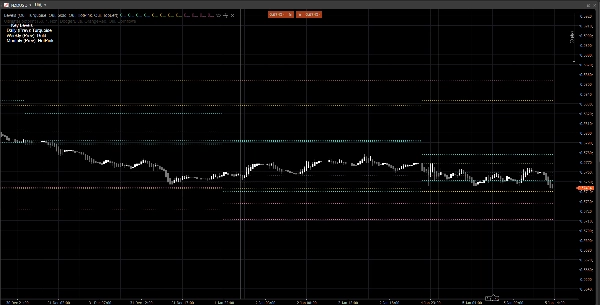
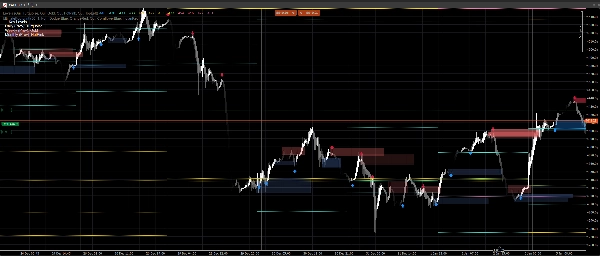
Price Action Zones is a lightweight, no-noise indicator that plots the previous Daily, Weekly, and Monthly key levels directly on your chart.
It displays:
- Previous Day: High / Low / Open / Close
- Previous Week: High / Low / Open / Close
- Previous Month: High / Low / Open / Close
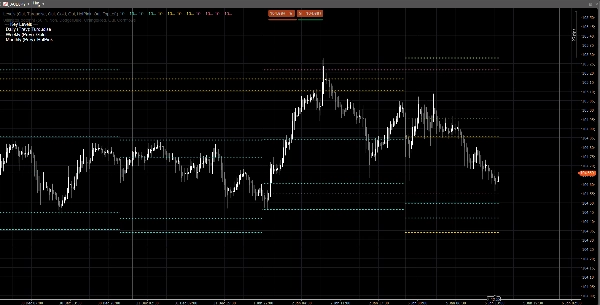
These levels are widely used as reaction zones, liquidity references, and context anchors for market structure, entries, targets, and risk placement.
Why it’s useful
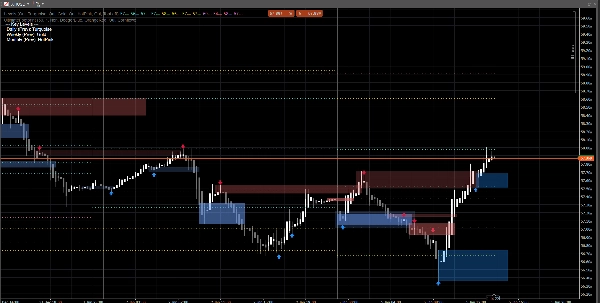
- Instantly see higher timeframe reference levels without switching charts
- Helps you frame intraday price action around PDH/PDL, PWH/PWL, PMH/PML
- Clean visual: levels remain constant for the current session/week/month
- Works on any symbol and timeframe
Customization
You can independently toggle each timeframe:
- Show Daily / Weekly / Monthly
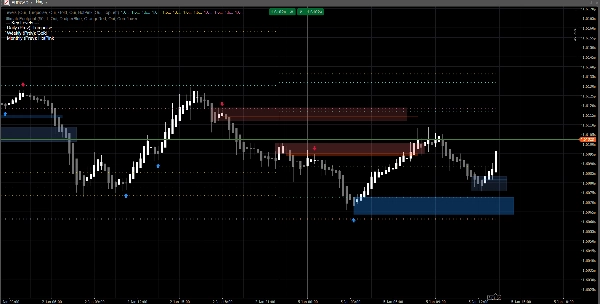
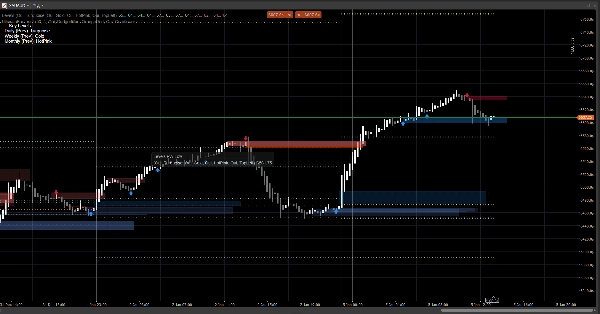
- Set a custom color for each group
- Enable a simple legend, with selectable corner positioning
Technical notes
- Levels are calculated using the previous completed Daily/Weekly/Monthly candle (not the current forming one).
- This prevents repainting and keeps the levels stable during the session.
Disclaimer
This indicator is provided for charting and decision support only. It does not generate buy/sell signals and is not financial advice. Always manage risk and validate on your own data.
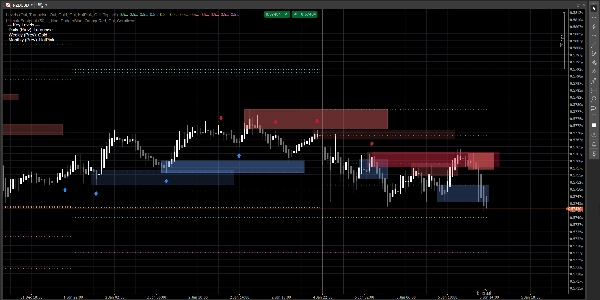
The signals on the chart are generated by the indicator Ultimate Footprint available on my profile.
Summary
Indicator profile
Customer reviews
0.0
Reviews: 0
Customer reviews
No reviews for this product yet. Already tried it? Be the first to tell others!
Discussion
FAQ
Prop
Forex
Indices
Commodities
Crypto
Stocks
Products available through cTrader Store, including trading bots, indicators and plugins, are provided by third-party developers and made available for informational and technical access purposes only. cTrader Store is not a broker and does not provide investment advice, personal recommendations or any guarantee of future performance.


Price
Since 23/07/2025
6.91M
Traded volume
27.63K
Pips won
877
Free installs