Brokers & props
For business
00
Days
:
00
Hours
:
00
Minutes
:
00
Seconds
Indicator
XAUUSD
Forex
EURUSD
GBPUSD
USDJPY
FX Market Sessions
5.0
03/01/2026
1176
Desktop
Since 04/04/2025
Sales
4
Free installs
1176
"FX Market Sessions" uploaded image"FX Market Sessions" uploaded image"FX Market Sessions" uploaded image"FX Market Sessions" uploaded image

Know exactly when major markets open and close. FX Market Sessions displays the four key trading sessions with their high and low levels, helping you time your entries around the most volatile hours of the day.


Key Features

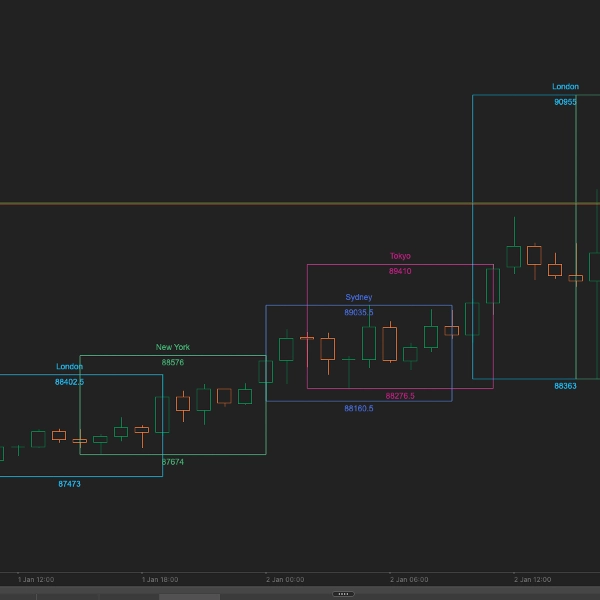
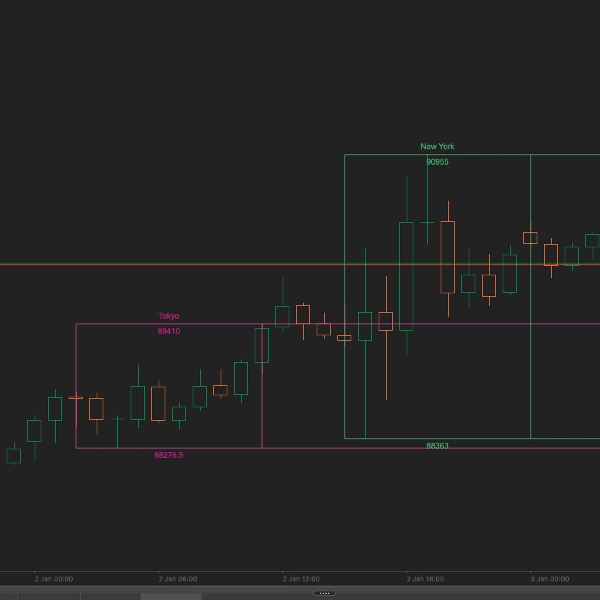
  • Four Major Sessions: Sydney, Tokyo, London, and New York sessions displayed with customizable start/end times and automatic DST adjustment
  • Session High/Low Levels: Automatically tracks and displays the high and low of each session with extendable lines for support/resistance planning
  • Live Session Display: Real-time info panel shows which sessions are currently open - no more guessing when London or New York begins
  • Historical Context: View up to 10 days of past session levels to see how price reacted at key session boundaries
  • Full Customization: Choose which sessions to display, pick custom colors, and decide whether to extend high/low levels infinitely


How It Works

The indicator automatically calculates the four major forex trading sessions based on their respective local time zones:

  • Sydney: 21:00-06:00 AEST (adjusts for DST)
  • Tokyo: 00:00-09:00 JST
  • London: 08:00-17:00 GMT (adjusts for DST)
  • New York: 13:00-22:00 EST (adjusts for DST)

Each session is drawn as a vertical zone with its high and low levels marked. The info panel in the top-right corner displays which sessions are currently open in real-time.


Parameters

General Settings

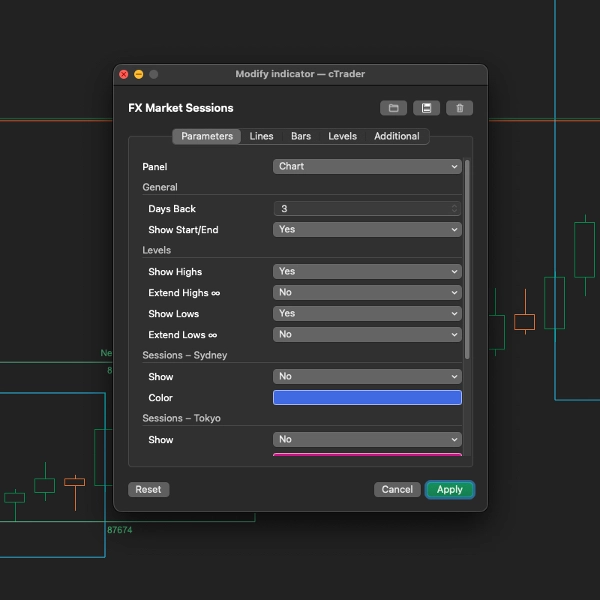
  • Days Back (Default: 3): Number of historical days to display session boxes (0-10)
  • Show Start/End (Default: True): Draw vertical lines at session open and close times

Level Settings

  • Show Highs (Default: True): Display the high level of each session
  • Extend Highs (Default: False): Extend high lines to the right edge of chart
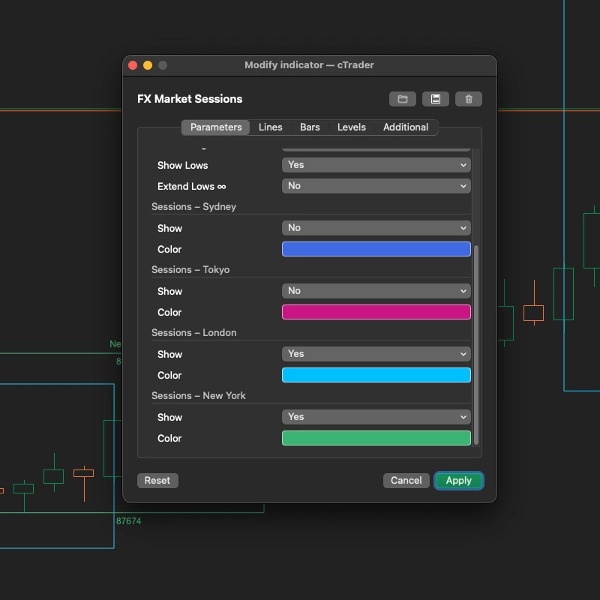
  • Show Lows (Default: True): Display the low level of each session
  • Extend Lows (Default: False): Extend low lines to the right edge of chart

Session Settings (Sydney, Tokyo, London, New York)

  • Show: Enable or disable individual sessions
  • Color: Custom color for each session's display elements


Ideal For

  • Day traders who need to know when volatility increases
  • Breakout traders who trade session opens
  • Traders using session high/low levels as support/resistance
  • Anyone wanting to visualize the best trading hours


Trading Tips

  • London Open: One of the most volatile periods - often sets the direction for the day
  • London/New York Overlap: 13:00-16:00 GMT typically has the highest volume and volatility
  • Asian Session: Best for trading JPY pairs and AUD pairs
  • Session Breakouts: Price breaking above/below a session's high/low can signal continuation moves


Supported Timeframes

Works optimally on timeframes from M5 to H4. The indicator automatically adjusts session boxes to fit the scale of your chart.

5.0
Reviews: 6
5
100 %
4
0 %
3
0 %
2
0 %
1
0 %
Customer reviews
December 23, 2025
August 12, 2025
Pros: Highlights Tokyo, London, and New York sessions with custom colors. Ultra-light performance. Clean and intuitive display. Cons: No alerts or tooltips. Missing template saving. Provides no trading signals by itself.
July 17, 2025
Muy útil.
May 13, 2025
It's a five star review from me. I've been searching for market session indicator until I found this. Best market session indicator!
May 8, 2025
Clean and simple! Does exactly what it says. Thanks for the great work!
May 4, 2025
Nice tool for session analysis!
More from this author
Indicator
NAS100
NZDUSD
Indices
+9
SSL Channel
Trend-following channel using dual MAs with visual cloud and optional alerts on crossovers
Indicator
NAS100
NZDUSD
XAUUSD
+10
UT Bot
Trend-following indicator with dynamic ATR-based trailing stop for precise entry/exit signals
You may also like
Indicator
Grid
RSI
Breakout
+6
Final Stochastic Oscillator
Final Stochastic Oscillator is a next-generation upgrade of the classic stochastic indicator
Cumulative Delta Candles + VolumeProfile
Cumulative delta candles + volume profile
VegaXLR - Fibonacci Alerts
Alerts you when price touches Fibonacci levels. Stay organized and trade efficiently!
Indicator
Grid
Indices
Prop
+4
Round Numbers
Automatically draws major, minor, and trace support/resistance levels at round numbers
Indicator
RSI
Breakout
Signal
+1
ZScore
Z-Score measures price deviation from its average, helping identify extremes, trends, and trading opportunities ........
Indicator
NAS100
NZDUSD
XAUUSD
+10
[Stellar Strategies] VBO
Next-gen Volume Oscillator using Hyperbolic Tangent math. No repainting. Includes arrows, alerts, and overlay mode 🎯
Order Block Detector SmartTrading
🎯 Order Block Detector - Smart Trading: Identifica bloques de órdenes clave en cTrader para un trading más inteligente.
Market Entropy
Market entropy + DC. Spot crystallization/chaos shifts with an optional on-chart overlay.
Indicator
NAS100
Indices
XAUUSD
+7
InstitutionalSignalOscillator
A precision-engineered indicator designed for traders who demand signal integrity across volatile markets.
Indicator
Grid
NZDUSD
Breakout
+16
vWAP Free
Editions: Free (core VWAP + bands) · Pro (multi‑VWAP, click‑to‑anchor, alerts).
VegaXLR - RSI and StochRSI Alerts
VegaXLR's cTrader StochRSI identifies overbought/oversold RSI levels for precise trade entries.
xhobaniFX_ADR-Lines
xhobaniFX_ADR-Lines: Average Daily Range Horizontal Lines
Indicator
Indices
Prop
Stocks
+3
Universal Assistant Toolkit - UATKit
A comprehensive workflow‑enhancement toolkit designed to make charting on cTrader smoother, clearer, and more efficient.
IR Candle MTF
with this indicator you could see other time frame candle in your chart.
Indicator
NAS100
NZDUSD
Martingale
+26
ADVANCED ICT + ADR + AWR SUITE PRO
ADVANCED ICT + ADR + AWR SUITE PRO (The Ultimate All-in-One Toolkit for Price Action Traders)
Vishal Volume Profile v2.0
Volume Profile plots traded volume at each price level, highlighting high activity zones of precise support & resistance
Morning Star On Chart
Morning Star pattern on chart (Bullish and Bearish) automatically marked with (BUY & SELL) Very powerful signals.
Indicator
Indices
Prop
Commodities
+3
LT_Ind_TradeNet
Personal trade tracker for a single symbol. Clear net profit summary — FreshNet, ManageNet, DayNet, WTDNet, MTDNet.