
Ariaware.003PGap
Indicator
73 downloads
Version 1.1, Jul 2026
Windows, Mac
5.0
Reviews: 1
Description
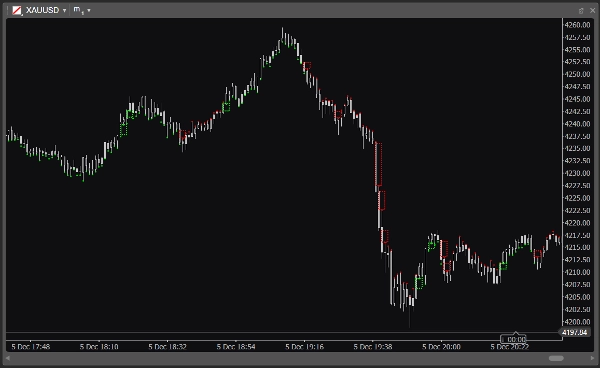
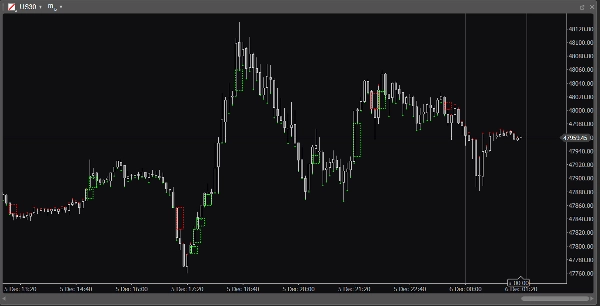
Pressure Gap Indicator
The Pressure Gap Indicator identifies sudden price displacements and missed price levels without relying on volume data. These gaps occur when the market moves aggressively, causing some traders to miss their preferred entry or exit prices.
Price often revisits these unfilled areas before continuing in the same direction. The indicator highlights these pressure zones, helping traders identify potential pullbacks and lower-risk entry opportunities aligned with the market trend.
Key Features:
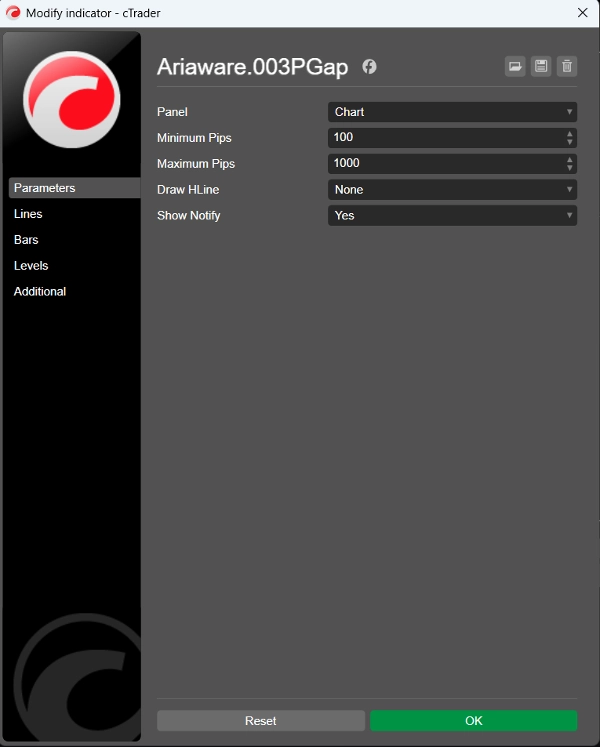
- Detects Fair Value Gaps (FVG) and Breakaway Gaps (BAG).
- Allows filtering and displaying only FVG, only BAG, or both simultaneously.
- Provides a clear visualization of significant price gaps and potential reaction zones.
- Helps traders analyze market structure and identify trend continuation opportunities.
Summary
AI summary
The Ariaware.003PGap is a Pressure Gap indicator designed to identify sudden price jumps and unfilled price levels without relying on volume data. It detects two types of gaps: Fair Value Gaps (FVG) and Breakaway Gaps (BAG), which occur during aggressive market moves that cause missed entry or exit prices for some traders. The indicator visually highlights these pressure zones, which price often revisits before continuing in the original direction. This feature helps traders identify potential pullbacks and lower-risk entry points aligned with the prevailing market trend. Users can filter the display to show only FVG, only BAG, or both simultaneously, facilitating detailed market structure analysis and trend continuation assessment.
Indicator profile
Customer reviews
5.0
Reviews: 1
5 | 100 % | |
4 | 0 % | |
3 | 0 % | |
2 | 0 % | |
1 | 0 % |
Customer reviews
December 10, 2025
Ariaware.003PGap marks micro-gaps and price discontinuities. Useful for spotting imbalance zones and liquidity voids. Works well across instruments but can get noisy on lower TFs. Great as an SMC/ICT supplementary tool, not a standalone entry trigger.
Discussion
FAQ
Fair Value Gap
Products available through cTrader Store, including trading bots, indicators and plugins, are provided by third-party developers and made available for informational and technical access purposes only. cTrader Store is not a broker and does not provide investment advice, personal recommendations or any guarantee of future performance.
More from this author


Price
246
Free installs