
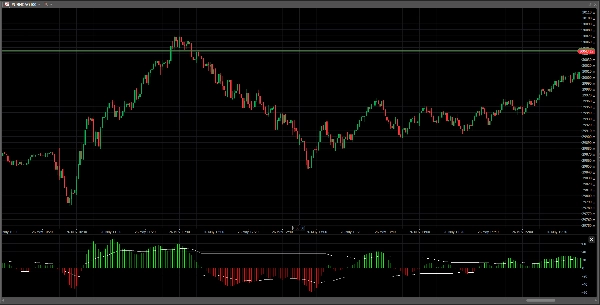

Description
EWO (Elliott Wave Oscillator)
The EWO is a valuable tool for traders who want to have a full view of the market and make informed decisions.
1) TRADING SYSTEM:
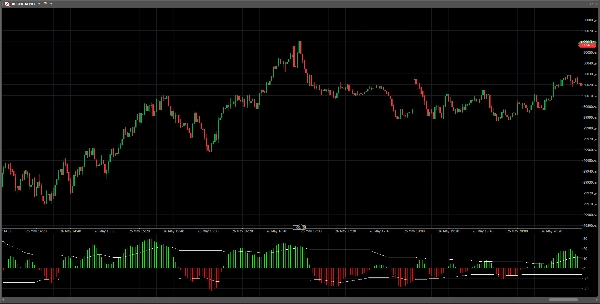
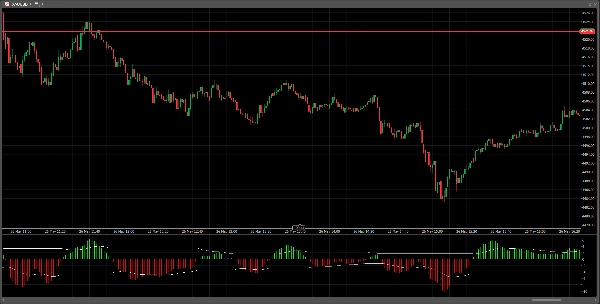
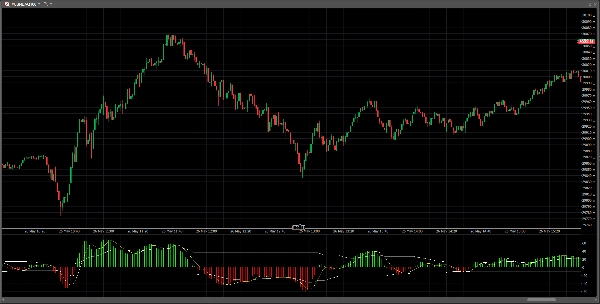
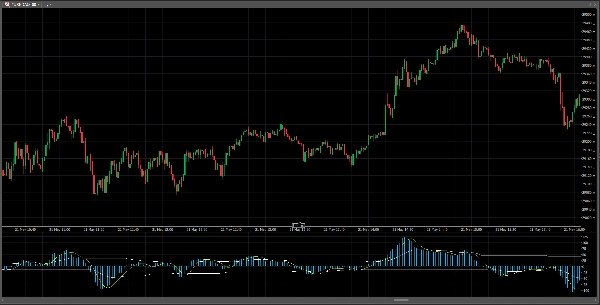
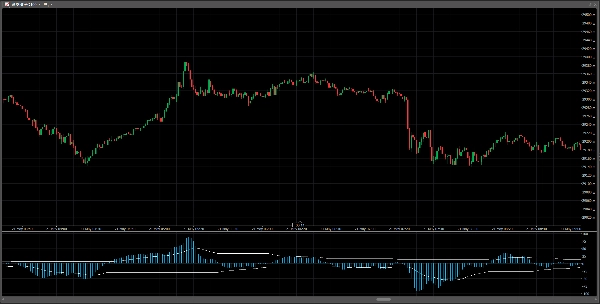
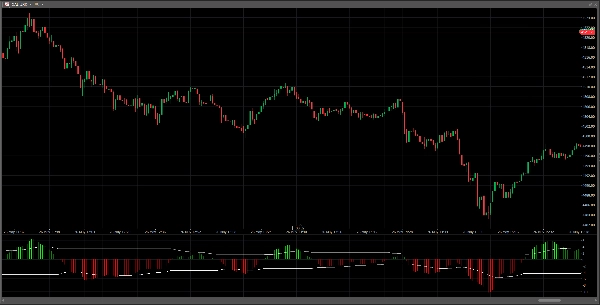
It works as a trading system on its own. It gives a buy signal when the histogram crosses the zero line upwards and a sell signal when the histogram crosses the zero line downwards.
2) INDICATES MOMENTUM:
Momentum refers to the strength and speed at which the price moves.
If momentum goes up, it means the price movement is gaining strength (more buyers or sellers pushing it).
If momentum goes down, the movement loses strength, even though the price can still continue in the same direction.
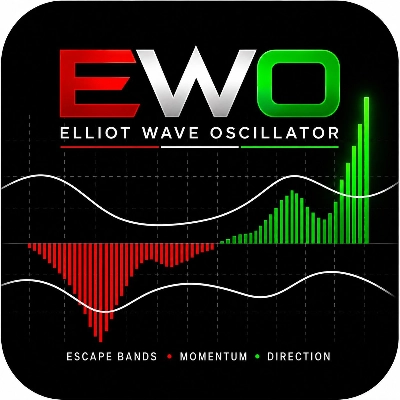
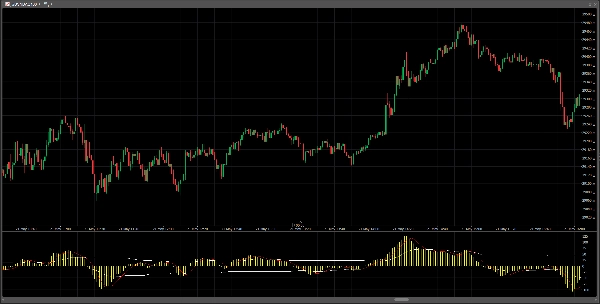
When the EWO histogram bars break the escape band, either up or down, it indicates that momentum is exceptionally strong and the market is entering a very powerful impulsive phase.
3) WAVE COUNT VALIDATOR:
Allows you to identify and validate waves (impulses and retracements) within the counting system proposed by Elliott.
EWO (Elliott Wave Oscillator)
El EWO es una herramienta valiosa para los traders que buscan obtener una visión completa del mercado y tomar decisiones informadas.
1) SISTEMA DE TRADING:
Funciona como un sistema de trading en sí mismo. Brinda una señal de compra cuando el histograma cruza la línea cero al alza y una señal de venta cuando el histograma cruza la línea cero a la baja.
2) INDICA EL MOMENTUM:
El momentum se refiere a la fuerza y velocidad con la que se mueve el precio.
Si el momentum aumenta, significa que el movimiento del precio tiene más fuerza (más compradores o vendedores empujándolo).
Si el momentum disminuye, el movimiento pierde fuerza, aunque el precio todavía pueda continuar en la misma dirección.
Cuando las barras del histograma del EWO rompen la banda de escape, ya sea al alza o a la baja, indica que el momentum es excepcionalmente fuerte y que el mercado está entrando en una fase impulsiva muy potente.
3) VALIDADOR DE CONTEO DE ONDAS:
Permite identificar y validar ondas (impulsos y retrocesos) dentro del sistema de conteo propuesto por Elliott.
Summary
Customer reviews
Discussion
FAQ
More from this author

















Price