"VWARSI_noSourceCode" logo
Indicator
Version 1.0, Dec 2025
Windows, Mac
4.3
Reviews: 3
"VWARSI_noSourceCode" uploaded image
Since 14/01/2025
53
Sales
10.81K
Free installs

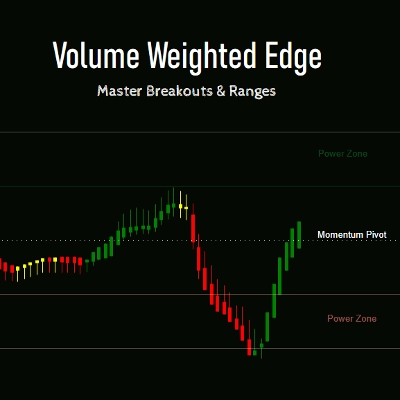
The Volume-Weighted Edge: A Complete Roadmap for cTrader Momentum

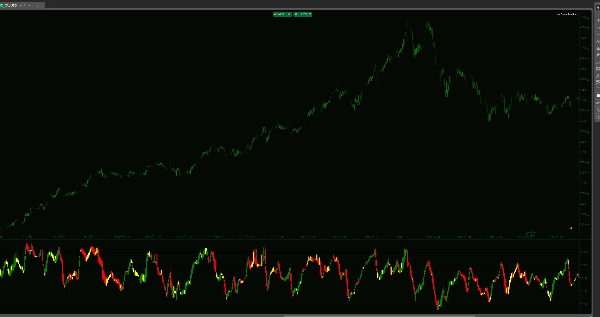
Standard indicators show you where the price has been. The Volume-Weighted RSI Candles indicator shows you the conviction behind the move. By merging price action, tick volume, and five critical institutional levels, this tool transforms the RSI from a simple oscillator into a comprehensive trend-mapping system.

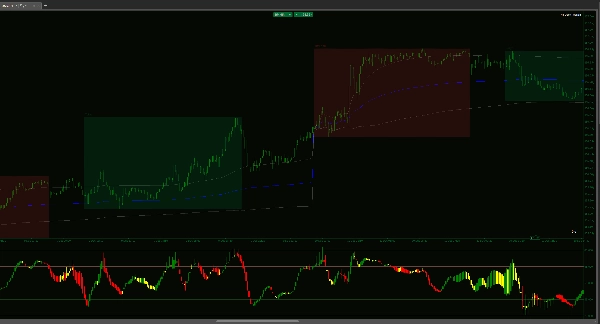
Instead of a single line, you get full OHLC candles in your indicator window. This allows you to see the "structure" of momentum—revealing whether a move is backed by heavy institutional volume or is simply a low-liquidity "fake-out."


The 5-Zone Execution Strategy

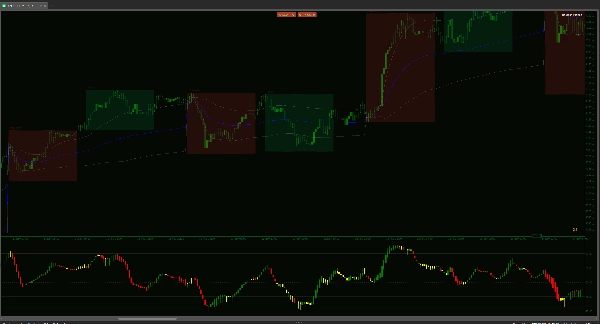
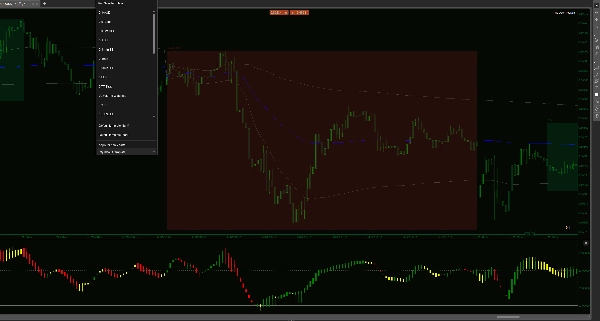
  • The Power Extensions (65–80 & 20–35): These are the high-conviction zones. When volume-weighted candles sustain themselves here, you aren't looking for reversals—you’re riding the trend. This is where big money operates, and where the most explosive moves happen.
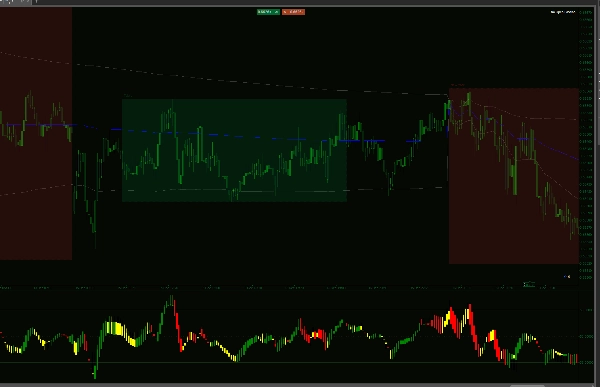
  • The Scalping Corridors (50–65 & 35–50): Perfect for the Asian session or range-bound markets. When the higher-timeframe trend is neutral, these zones provide high-probability "mean reversion" targets. If the market is ranging, these corridors allow you to scalp the rotations with surgical precision.
  • The Momentum Pivot (50): The ultimate line in the sand. A volume-weighted candle body closing across this level is your first warning of a structural shift in market control.


Why This Tool Changes Your Workflow

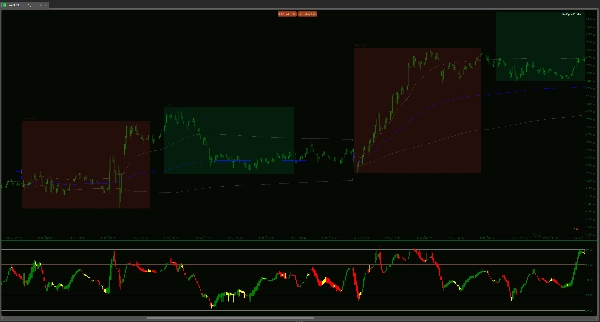
Volume-Weighted Clarity: Every candle is calculated by multiplying price change by tick volume. If a move happens on thin volume, the RSI candle won't confirm it. This keeps you out of "trap" moves that look good on the price chart but have no backing.

Candle-Body Insights: Traditional RSI lines are nervous and jagged. Our WMA-smoothed candles show you the "open" and "close" of momentum. If the RSI candle body is thick and solid, the trend is healthy. If the wicks are long, the momentum is exhausted.

Multi-Market Versatility: * Trending: Use the 65–80 range to stay in winning trades longer.

Ranging/Scalping: Use the 35–65 corridors to catch quick rotations during lower-volatility sessions like Asia.

Avoid the "Barcode" Trap: Most indicators force you to guess during low-volatility periods. This indicator features a unique visual "Barcode" effect during consolidation. When the candles tighten, flatten, and turn neutral, the indicator is telling you that the "market engine" is off. This visual warning saves you from entering low-volume fake-outs and getting "chopped up" when there is no real money behind the price movement.

Native cTrader Optimization: Built specifically for the C# API with "Max Visual Candles" logic to ensure your platform remains responsive, even on 1-minute charts.


Stop trading based on where the market might go. Start trading based on where the volume is actually pushing it. This indicator isn't just about signals—it’s about understanding the internal energy of the market.

Indicator profile
4.3
Reviews: 3
5
33 %
4
67 %
3
0 %
2
0 %
1
0 %
Customer reviews
December 28, 2025
December 27, 2025
The cleanest use is it brings another read without hijacking the plan. The market context still matters.
December 26, 2025
the noisy parts of the chart show up earlier, but the chart still needs say no.
BTCUSD
Forex
Breakout
Indices
EURUSD
Commodities
GBPUSD
NZDUSD
RSI
Prop
Scalping
Crypto
Stocks
XAUUSD
NAS100
USDJPY
VWAP
Products available through cTrader Store, including trading bots, indicators and plugins, are provided by third-party developers and made available for informational and technical access purposes only. cTrader Store is not a broker and does not provide investment advice, personal recommendations or any guarantee of future performance.

More from this author

Indicator
Forex
Crypto
+3
Track major trading sessions (Tokyo, London, New York) with customizable colors and visual sessions on your chart.
Indicator
Auto-detect supply & demand zones, remove broken levels, and trade smarter with real-time alerts. Precision made simple.
Indicator
Forex
Market Session V2: Full Control. colors, history, session/text toggles, font size. Elevate your strategy!
Indicator
Forex
Version 3: Full control of session display including start and end times of all 3 sessions!
Indicator
Supply and demand zones. They're important. Here's a free version to get you started!
Indicator
The Multi-Timeframe Candle Indicator displays candles from multiple timeframes in one window, enhancing market analysis!
Indicator
VWAP
VWAP Set to London Open
Indicator
The Advanced Volume Profile Indicator calculates POC, Median, and Mode, revealing key price levels for smarter trading.
Indicator
SMC
Prop
+13
Smart Money Suite (Lite): BOS, CHoCH, Swing structure, PDH/PDL & session killzones. Essential SMC tools, zero clutter.
Indicator
BOS
MSS
+2
Stay ahead with a real-time countdown to candle closes on all key timeframes: 5m, 15m, 30m, 1H, 4H, and Daily.
Indicator
Forex
EURUSD
+3
US Dollar Index
Indicator
Forex
NZDUSD
+2
RCS: 8 majors! AUD,USD,EUR,JPY,GBP,CAD,CHF,NZD. Find how strong each currency is relatively and trade smarter!

You may also like

Indicator
Prop
Forex
+4
A precision-crafted indicator that compares current volume to its historical average for the same time of day.
Indicator
EMA
Supertrend
+4
Dynamic dual MA cloud indicator. Identifies trends, crossovers, and pullback entries in real time for any asset.
Indicator
Forex
BTCUSD
+12
🎯Automatically identifies the market's significant turning points (key H & L) and draws dynamic support and.....✍️
Indicator
Forex
BTCUSD
+10
Trend-following channel using dual MAs with visual cloud and optional alerts on crossovers
Indicator
Breakout
Allow trader to visualize Support & Resistance across different timeframes,give trader an overview of the current market
Indicator
ATR
RSI
+7
Identify bullish and bearish Order Blocks to spot key support/resistance levels and potential trend reversals! 📈🔄
Indicator
EMA
SMA
+3
MACD indicator modeled after TradingView, featuring a 4-color momentum histogram, sound/pop-up crossover alerts.
Indicator
[Hamster-Coder] Pivot Points (Multi Time Frame)
Indicator
Three ZigZag lines
Indicator
Spread Filter
SpreadSync Entry Timer is a compact cTrader indicator that shows live spread and candle-close.
Indicator
ATR
Market Structure
+3
Support Resistance Toolkit
Indicator
RSI
SMA
+1
TradingView RSI replica for cTrader with dynamic gradients, automatic divergence detection, and alerts.
Indicator
MACD
Key Levels
+2
Trend indicator with multi-timeframe filters, generating signals only on fully completed bricks & candles. No Repaint.
Indicator
ATR
Flag
+5
Decision panel with Buy/Sell scores, market bias, setup quality, trading cost and clear trade reasons.
Indicator
MACD
Crypto
A simple tool to control market sessions. fixed the display on the weekend.
Indicator
Forex
BTCUSD
+11
Unlock trading precision with QQE! Dual QQE indicators with a Bollinger Bands zero line provide clear buy/sell signals.
Indicator
RSI
Indicator Stochastic With RSI
Indicator
ATR
Forex
+1
Trade fearlessly: auto-adjusts order blocks, manages risks, and ensures precision. Free for early users.
Since 14/01/2025
53
Sales
10.81K
Free installs