

Description
MyZtrade MTF ATR Zones — Multi-Timeframe ATR-Based Support & Resistance Zones
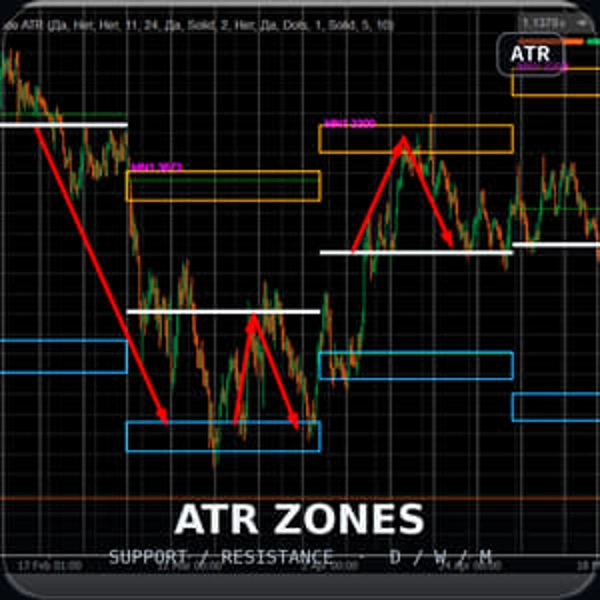
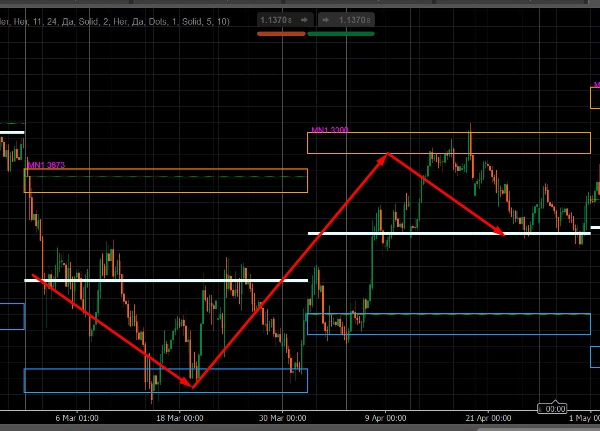
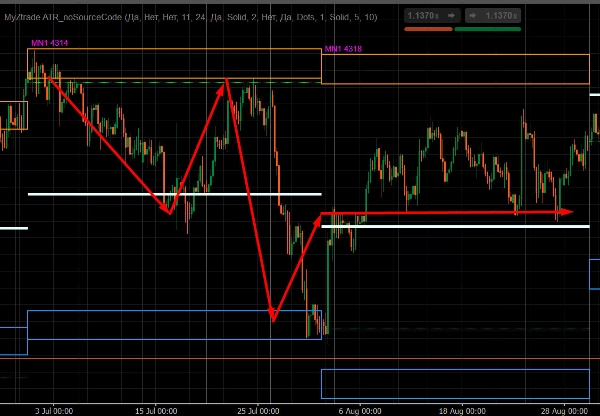
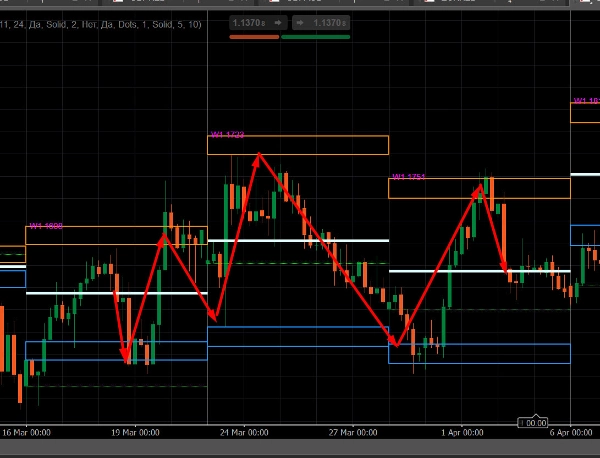
This indicator draws potential reversal zones (support/resistance) on the chart based on the average High–Low range of higher timeframe bars — Monthly, Weekly, and Daily — independent of the chart's own timeframe.
What It Does
For each enabled timeframe (Monthly / Weekly / Daily), the indicator:
• Calculates the average range (High–Low) over a specified number of the most recent bars in that timeframe (default: 11 bars)
• Plots rectangular resistance and support zones on the chart, offset from the high/low of each bar by the value of this average range
• Labels each zone with the volatility value in points and the timeframe prefix (for example, MN1 2696, W1 1180, D1 340) — useful when multiple timeframes are enabled simultaneously
• Additionally draws the bar's opening price line and the median line within the zone
• Separately tracks the current (not yet closed) bar — its zone moves in real time as the bar develops
Key Features
• Multiple timeframes simultaneously — Monthly, Weekly, and Daily can be enabled independently of one another
• Not tied to the chart's timeframe — you can view monthly zones on an hourly chart, etc.
• Fully customizable appearance — colors, line thickness and style, zone fill/outline, text size
• Serves as a visual guide; does not generate trading signals and does not contain entry/exit logic
Summary
Each zone is labeled with its volatility value in points and the corresponding timeframe prefix (e.g., MN1, W1, D1) to distinguish multiple enabled timeframes. Additional visual elements include the bar’s opening price line and a median line within each zone. The indicator also tracks the current, developing bar in real time, updating its zone dynamically.
Key features include simultaneous display of multiple timeframes, full customization of visual appearance (colors, line styles, text size), and independence from the chart’s timeframe, allowing monthly zones to be viewed on intraday charts. This tool serves as a visual guide for support and resistance levels based on volatility but does not provide trading signals or entry/exit logic.
Customer reviews
Discussion
FAQ
More from this author





















Price
