

Description
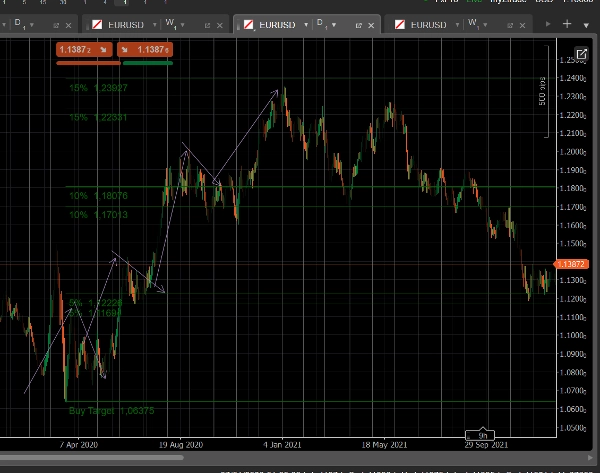
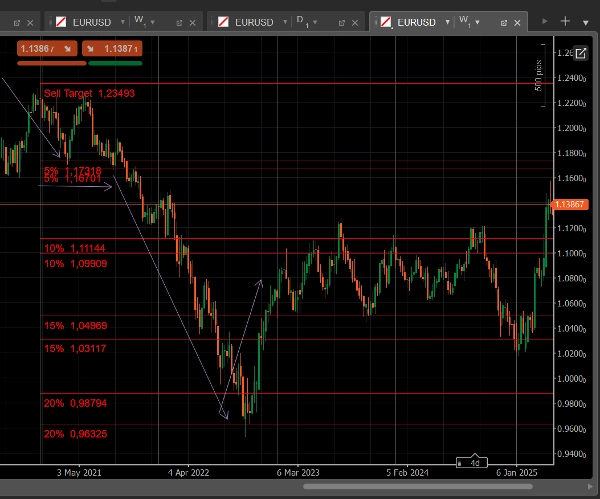
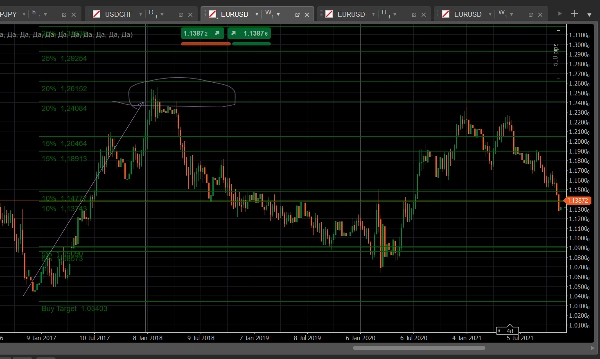
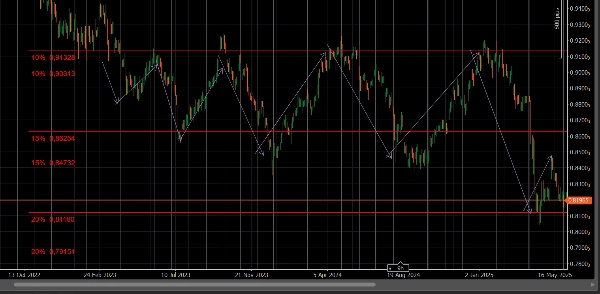
MyZtrade MM Levels builds price zones from the exact points where the market maker turns price around: the highs and lows of significant swings. Instead of fully automatic zones, you choose the extreme yourself — the indicator then projects potential reversal and correction zones directly from it.
How it works:
- Click near the high or low of the candle you want to build zones from.
- Press Q to build a wide set of zones from that point.
- Press W to build a finer, more precise set of zones from the same point.
- Every zone is labeled with its exact price — no manual calculation needed.
Why it helps:
- Instantly visualizes where a correction or reversal could reach from a key high/low, without doing the math yourself.
- Two independent zone sets — one for a quick read of the chart, one for precise mapping.
- Every zone can be toggled on or off individually, so your chart only shows what you need.
Built for a clean workflow:
- Group delete: remove one line from a zone set (Buy or Sell) and the whole set disappears at once — no manual chart cleanup.
- Configurable line style (dashed/solid) and separate colors for Buy and Sell zones.
- Optional paired lines for traders who work with ranges rather than single price points.
Who it's for: traders who work from key highs and lows and want to map out potential reversal or correction zones quickly, without switching to a calculator.
Summary
AI summary
MyZtrade MM Levels v1.2 is a trading indicator designed to identify potential market maker reversal and correction zones based on key price extremes. Users manually select a significant high or low on the chart, then generate price zones projecting where corrections or reversals may occur. The indicator offers two zone sets: a broad set for quick analysis (activated by pressing Q) and a finer, more precise set (activated by pressing W). Each zone is clearly labeled with its exact price level, eliminating the need for manual calculations.
Key features include individual toggling of zones for customized chart views, group deletion of entire zone sets for efficient cleanup, configurable line styles and colors distinguishing Buy and Sell zones, and optional paired lines for range-based trading. The tool supports analysis based on classical support and resistance concepts and integrates elements related to Fibonacci, order blocks, supply and demand, liquidity grabs, and premium/discount zones.
MyZtrade MM Levels is intended for traders who focus on key highs and lows to quickly map potential reversal or correction areas without additional calculations, facilitating a streamlined workflow and enhanced chart clarity.
Key features include individual toggling of zones for customized chart views, group deletion of entire zone sets for efficient cleanup, configurable line styles and colors distinguishing Buy and Sell zones, and optional paired lines for range-based trading. The tool supports analysis based on classical support and resistance concepts and integrates elements related to Fibonacci, order blocks, supply and demand, liquidity grabs, and premium/discount zones.
MyZtrade MM Levels is intended for traders who focus on key highs and lows to quickly map potential reversal or correction areas without additional calculations, facilitating a streamlined workflow and enhanced chart clarity.
Indicator profile
Indicator category
Support & resistance
Output type
Visualisation
Data requirements
Bars only
Supported signals
Breakout
Reversal
Level touch
Level break
Customer reviews
0.0
Reviews: 0
Customer reviews
No reviews for this product yet. Already tried it? Be the first to tell others!
Discussion
FAQ
Fibonacci
Premium/Discount
Order Block
Supply & Demand
Channel
Liquidity Grab
Support & Resistance
Products available through cTrader Store, including trading bots, indicators and plugins, are provided by third-party developers and made available for informational and technical access purposes only. cTrader Store is not a broker and does not provide investment advice, personal recommendations or any guarantee of future performance.
More from this author





















Price

Since 28/06/2025