
설명
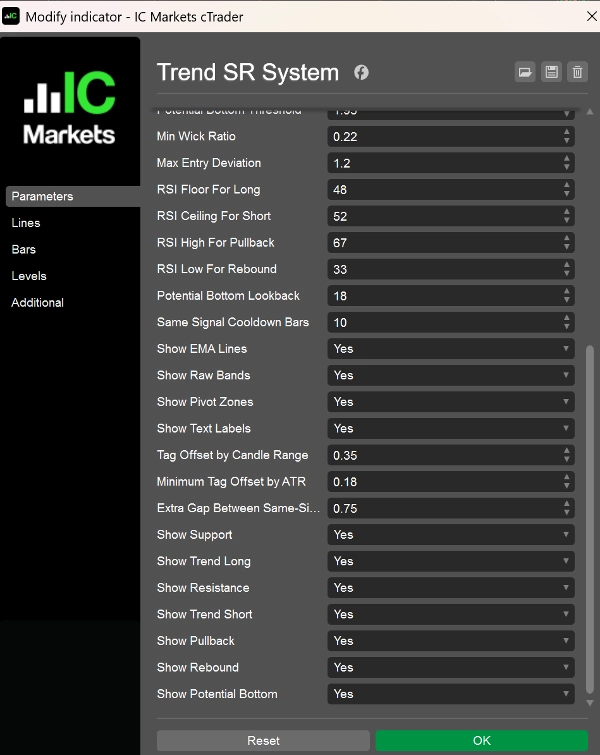
Trend SR 시스템은 트레이더가 시장 상황, 주요 EMA 구조, 동적 지지/저항 수준 및 잠재적인 지속 또는 단기 평균 회귀 구역을 보다 명확하게 식별할 수 있도록 설계된 추세 지향 차트 지표입니다.
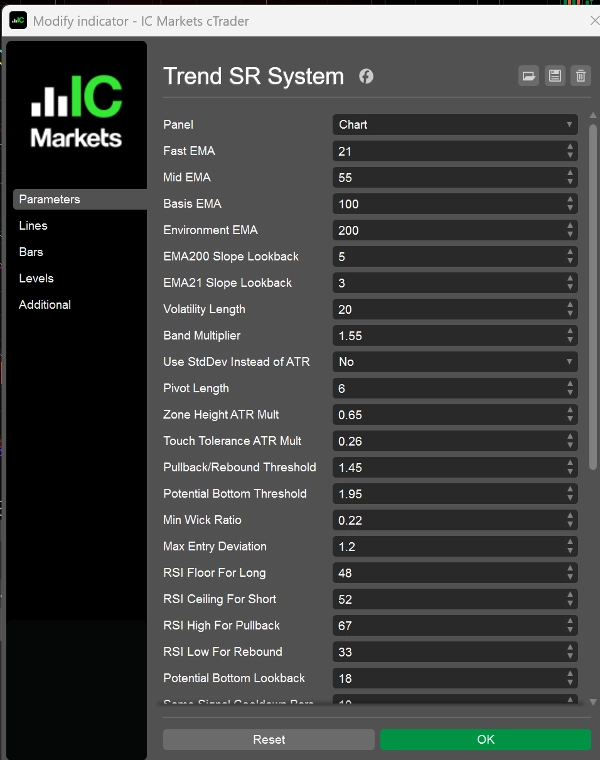
이 지표는 EMA21, EMA55, EMA100 및 EMA200을 중심으로 구축되었습니다:
- EMA200은 상위 수준의 시장 환경 필터로 사용됩니다
- EMA100은 중심 가격 축 및 밴드 기준선 역할을 합니다
- EMA55는 중기 지지 및 저항 압력을 식별하는 데 도움을 줍니다
- EMA21은 단기 리듬, 되돌림 및 조정을 추적하는 데 사용됩니다
이와 더불어, 이 지표는 변동성 밴드, 피벗 기반 구조 구역 및 단계식 동적 지지/저항 논리를 결합하여 시장에 대한 보다 구조화된 관점을 제공합니다.
주요 특징
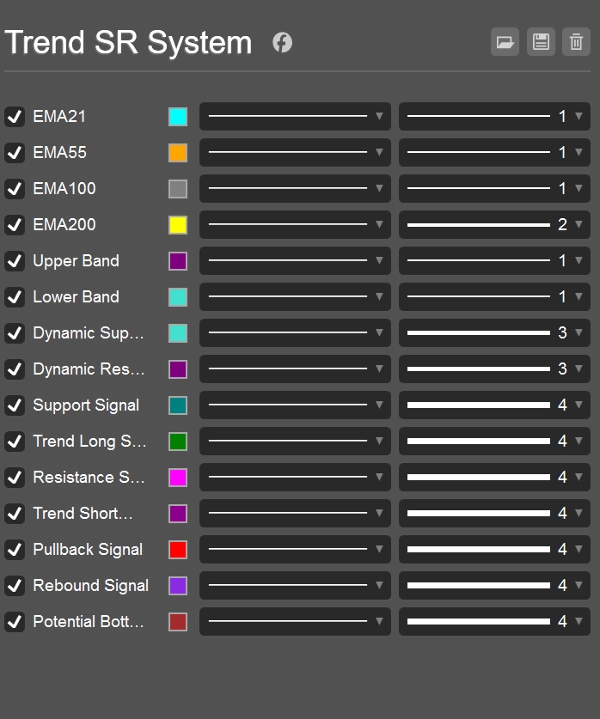
- 4개의 주요 EMA 구조선을 표시합니다
- ATR 또는 표준 편차를 기반으로 상단 및 하단 밴드를 보여줍니다
- 동적 지지 및 동적 저항 수준을 생성합니다
- 피벗 논리를 사용하여 구조적 지지/저항 영역을 감지합니다
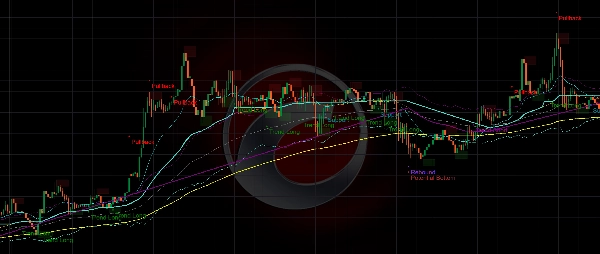
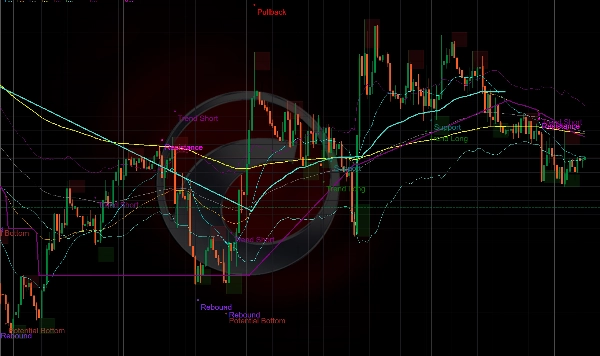
- 지속 유형 및 단기 조정 유형 신호를 제공합니다
- 개별 신호 유형을 켜거나 끌 수 있습니다
신호 유형
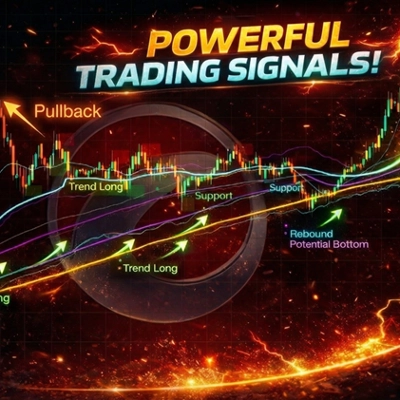
- 지지
강세 환경에서의 주요 지지 구역으로, 되돌림 후 가격이 방어되고 있음을 나타냅니다. - 추세 롱
강세 시장에서 추세를 따르는 롱 신호로, 일반적으로 되돌림 후 상승 모멘텀이 재개될 때 나타납니다. - 저항
약세 환경에서의 주요 저항 구역으로, 조정 후 가격이 제한되고 있음을 나타냅니다. - 추세 숏
약세 시장에서 추세를 따르는 숏 신호로, 반등이 힘을 잃고 하락 추세가 재개될 때 일반적으로 나타납니다. - 되돌림
강세 환경에서 단기 과도 확장 경고로, 되돌림 또는 조정 위험을 시사합니다. - 반등
약세 환경에서 단기 과매도 경고로, 기술적 반등 위험을 시사합니다. - 잠재적 바닥
더 강한 과매도 회복 유형 신호로, 임시 바닥 형성 시도를 강조합니다.
일반적인 사용 사례
이 지표는 다음에 적합합니다:
- 추세 추종 분석
- 되돌림 및 조정 진입 타이밍
- EMA 구조 및 지지/저항 관찰
- 과도 확장된 강세 또는 약세 상태 모니터링
- 차트 기반 거래 필터링 및 재량적 의사결정 지원
외환, 지수, 금속, 암호화폐 및 기타 추세 시장 전반에 걸쳐 사용할 수 있습니다.
최적 대상
이 지표는 다음과 같은 트레이더를 위해 설계되었습니다:
- 더 명확하고 구조화된 차트 뷰를 원하는 사람
- 추세 지속 및 주요 반응 구역에 집중하는 사람
- 가격 행동 및 지지/저항과 함께 EMA 구조를 사용하는 사람
- 단기에서 중기 설정에 시각적 거래 지원을 선호하는 사람
사용 시 주의사항
- 시장 상황 및 건전한 위험 관리와 함께 사용하는 것이 가장 좋습니다
- 신호를 단독 거래 조언으로 간주해서는 안 됩니다
- 변동성이 낮거나 변동성이 불규칙한 시장 상황에서는 신호 품질이 저하될 수 있습니다
- 이는 차트 분석 및 거래 지원 도구로 의도된 것이며, 성능 보장 시스템이 아닙니다
요약
AI summary
Trend SR System is a trend-focused trading indicator that integrates four key exponential moving averages (EMA21, EMA55, EMA100, EMA200) with volatility bands and dynamic support/resistance levels. EMA200 serves as a higher-level market environment filter, EMA100 as the central price axis, EMA55 to identify medium-term support/resistance pressure, and EMA21 to track short-term price rhythm and pullbacks. The indicator overlays volatility bands based on ATR or standard deviation and uses pivot-based logic to detect structural support and resistance zones.
It provides multiple signal types including support, resistance, trend-following longs and shorts, pullback warnings, rebounds, and potential bottom formations. These signals assist in identifying continuation setups and short-term mean-reversion opportunities. Users can enable or disable individual signal types according to their preferences.
Designed for use across forex, indices, commodities, metals, cryptocurrencies, and other trending markets, the Trend SR System supports trend-following analysis, entry timing on pullbacks, and monitoring of EMA structure alongside price behavior. It is intended as a chart analysis and trade support tool to enhance visual clarity of market context and key reaction zones, best used in conjunction with sound risk management and broader market analysis.
It provides multiple signal types including support, resistance, trend-following longs and shorts, pullback warnings, rebounds, and potential bottom formations. These signals assist in identifying continuation setups and short-term mean-reversion opportunities. Users can enable or disable individual signal types according to their preferences.
Designed for use across forex, indices, commodities, metals, cryptocurrencies, and other trending markets, the Trend SR System supports trend-following analysis, entry timing on pullbacks, and monitoring of EMA structure alongside price behavior. It is intended as a chart analysis and trade support tool to enhance visual clarity of market context and key reaction zones, best used in conjunction with sound risk management and broader market analysis.
지표 프로필
지표 카테고리
추세
출력 유형
신호
데이터 요구 사항
막대만
지원되는 신호
반전
돌파
추세 강도
고객 리뷰
4.0
리뷰: 3
5 | 0 % | |
4 | 100 % | |
3 | 0 % | |
2 | 0 % | |
1 | 0 % |
고객 리뷰
April 9, 2026
a quiet demo run gives a better read. The chart idea becomes easier to explain.
April 8, 2026
April 5, 2026
상담
자주 묻는 질문(FAQ)
Prop
Forex
Signal
Indices
Supertrend
Commodities
RSI
Crypto
Stocks
ATR
트레이딩 봇, 지표, 플러그인 등 cTrader Store에서 제공되는 상품은 제3자 개발자에 의해 제공되며, 이는 단순히 정보 및 기술적 접근을 목적으로 제공된 것입니다. cTrader Store는 중개인이 아니며, 투자 조언, 개인별 추천 또는 향후 성과에 대한 어떠한 보장도 제공하지 않습니다.
이 작성자의 상품 더 보기


















가격
가입일 25/03/2026