Description
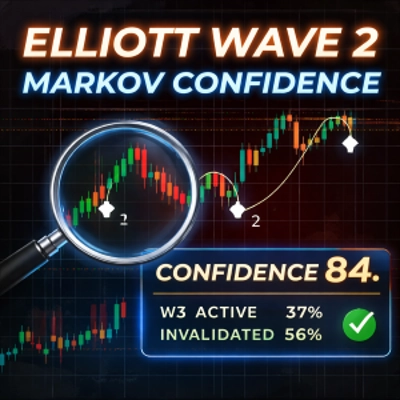
Elliott CLEAN — Wave2 + Markov Confidence
Elliott CLEAN is an advanced analytical indicator designed to help traders identify, validate, and manage Elliott Wave 2 setups using a combination of market structure and statistical probability.
Instead of predicting price direction, the indicator focuses on structural transitions and answers a more useful question:
How likely is a Wave 2 to evolve into a valid and sustainable Wave 3 — and how much confidence should the trader have in that scenario?
What This Indicator Does
Elliott CLEAN automatically:
- Detects Wave 1–Wave 2 structures based on swing pivots
- Defines trigger, stop-loss, invalidation, and Wave 3 targets
- Tracks historical structural outcomes using a 5-state Markov model
- Calculates conditional probabilities for:
- Wave 3 activation
- Setup invalidation
- Early Wave 3 exhaustion
- Converts these probabilities into a single Confidence Score (0–100)
This allows traders to filter low-quality setups, avoid over-trading, and press trades only when structure and statistics align.
Core Features
- ✅ Automatic Elliott Wave 2 detection
- ✅ Multiple confirmation modes (Break+Hold, Break, Reclaim, Wick)
- ✅ Clear trigger, stop-loss, invalidation, and projected targets
- ✅ 5-state Markov probability engine (event/swing-based, not bar-based)
- ✅ Real-time conditional probabilities shown on chart
- ✅ Single Confidence Score (0–100) for decision support
- ✅ Clean, non-intrusive HUD design
- ✅ Works on any symbol and any timeframe
The Confidence Score (Important)
The Confidence Score is not a win-rate and not a signal.
It is a contextual quality metric derived from historical structural transitions:
- During Wave 2, the score reflects:
- The probability of Wave 3 starting
- Adjusted by the probability of early failure
- During Wave 3, the score reflects:
- The historical likelihood that Wave 3 continues without early exhaustion
In practice:
- Low scores = structure is weak or unreliable
- High scores = structure is rare but statistically robust
This helps traders decide when to stay cautious and when to let a trade work.
Typical Use Cases
- ✔ Filtering Elliott Wave setups before entry
- ✔ Avoiding marginal or low-quality Wave 2 trades
- ✔ Adjusting position size based on confidence
- ✔ Managing Wave 3 trades with less emotional interference
- ✔ Supporting discretionary trading with objective structure data
The indicator is especially useful for traders who already understand Elliott Wave theory and want quantitative confirmation without automation.
How to Use (Basic Workflow)
- Attach the indicator to a chart
- Select your preferred confirmation mode
- Wait for a valid Wave 2 structure
- Observe:
- Trigger, stop-loss, invalidation
- Markov probabilities
- Confidence Score
- Decide whether the setup is worth trading based on structure + confidence
Important Notes & Disclaimer
- This indicator is analytical, not predictive
- It does not generate buy/sell signals
- Past structural statistics do not guarantee future results
- Trading involves risk; users are fully responsible for their decisions
The indicator is intended as a decision-support tool for discretionary traders.
Who This Indicator Is For
- Traders familiar with Elliott Wave concepts
- Discretionary traders who value structure over indicators
- Traders seeking objective filters, not automated systems
- Users who want probability context, not hindsight labels
_______________________
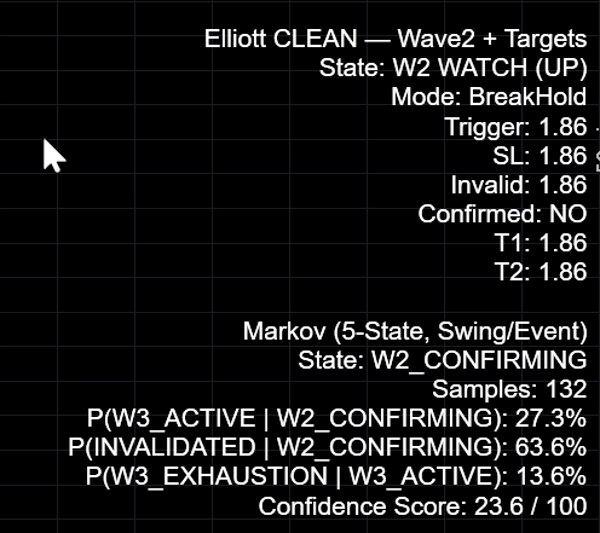
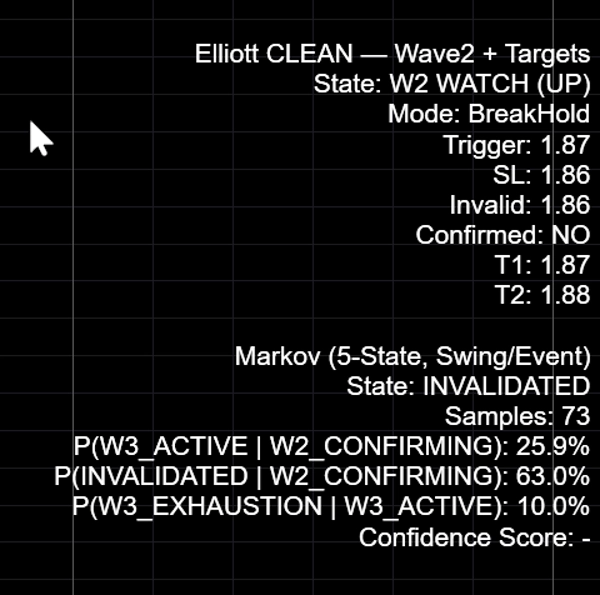
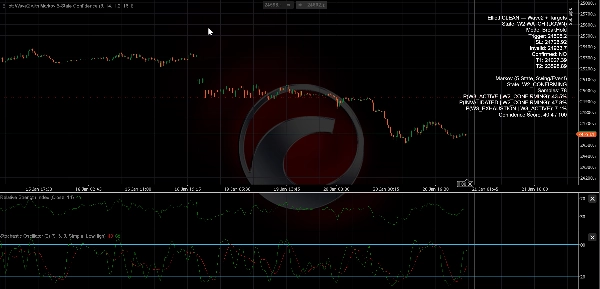
HUD & States
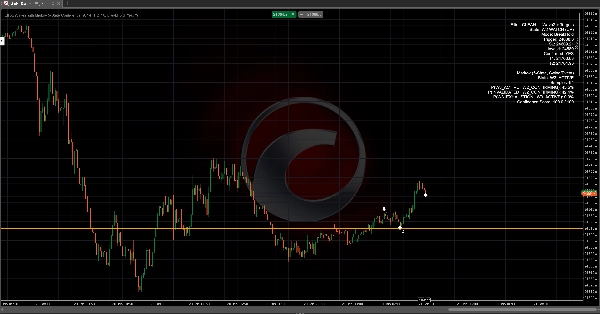
The indicator prints structure levels and Markov probabilities directly on chart.
Core Elliott layer:
- State: W2 WATCH (UP/DOWN) — potential Wave 2 is present (structure found)
- Confirmed: YES/NO — your selected confirmation rule has triggered
- Trigger — level price must break/reclaim (depends on mode)
- SL — suggested protective stop level (depends on SL mode)
- Invalid — structural invalidation level (Wave 1 start)
- T1/T2 — Wave 3 projections using multipliers
Markov layer:
- State — current Markov state (e.g.,
W2_CONFIRMING,W3_ACTIVE,INVALIDATED) - Samples — historical count used for probabilities
- P(W3_ACTIVE | W2_CONFIRMING) — chance Wave 3 activates from Wave 2 phase
- P(INVALIDATED | W2_CONFIRMING) — chance setup fails during Wave 2 phase
- P(W3_EXHAUSTION | W3_ACTIVE) — chance Wave 3 fails early once active
Confidence Score (0–100)
The Confidence Score is not a win-rate and not a guarantee. It is a quality metric derived from historical structural transitions.
How the score is used:
- During
W2_CONFIRMING, score reflects “activation likelihood” adjusted by early-failure risk. - During
W3_ACTIVE, score reflects “continuation robustness” (low early exhaustion risk).
Always interpret the score together with: (1) structure clarity, (2) invalidation distance, and (3) sample size.
Inputs (What they do)
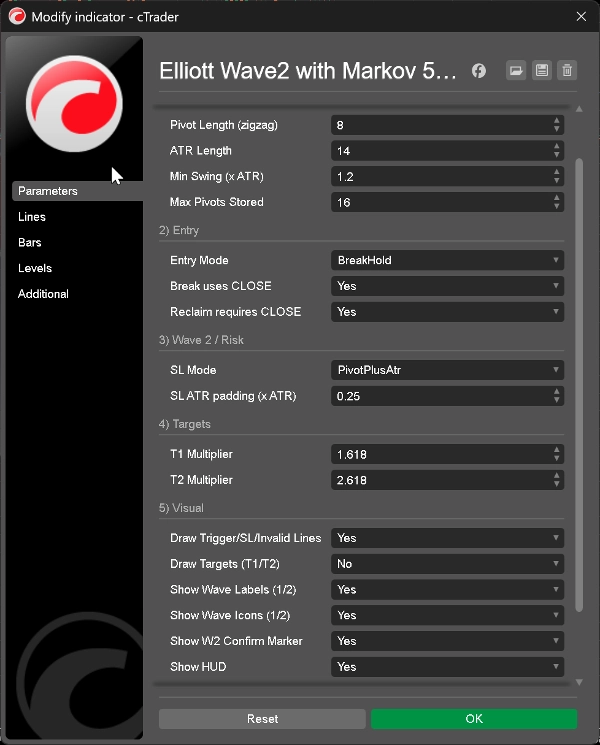
1) Pivot / Structure
- Pivot Length (zigzag): Controls swing sensitivity. Higher = fewer swings, cleaner structure.
- ATR Length: ATR window used for swing filtering and optional SL padding.
- Min Swing (×ATR): Minimum swing size to accept a pivot (filters noise).
- Max Pivots Stored: Limits stored swing history (performance & stability).
2) Entry
- Entry Mode: Choose confirmation style:
BreakHold— safer: break then hold beyond triggerBreak— faster: break trigger onceReclaim— sweep + reclaim behaviourWick— aggressive: wick through trigger
- Break uses CLOSE: Uses close instead of wick for break logic (recommended).
- Reclaim requires CLOSE: Requires a close on the correct side after sweep.
3) Wave 2 / Risk
- SL Mode: Determines stop placement baseline.
- SL ATR padding (×ATR): Extra buffer when using ATR-based stop.
4) Targets
5) Visual
- Draw Trigger/SL/Invalid Lines: Show/hide core horizontal levels.
- Draw Targets: Optional target lines (less “clean”).
- Show Wave Labels / Icons: Display wave markers (1/2).
- Show W2 Confirm Marker: Shows confirmation marker.
- Show HUD: Show/hide the entire HUD.
How to use:
- Scan multiple markets, then focus only on higher-quality structural environments.
- Use score + sample size to decide when a setup is worth time and risk.
FAQ
Does this work on all symbols and timeframes?
Yes. It is a structure-based approach. Outcomes and probabilities will vary by market behaviour and volatility.
Is the Confidence Score a win-rate?
No. It is a structural quality score derived from historical state transitions (Markov model). It does not guarantee outcomes.
Why is the score often low during Wave 2?
Because Wave 3 activation is selective. Many Wave 2 candidates fail or chop. The indicator is designed to filter those out.
What about low sample size?
Treat probabilities as less stable when sample size is small. Use the score as context, not certainty.
Risk Disclaimer
Trading involves risk and may not be suitable for all investors. Past performance and historical probability do not guarantee future results. This indicator provides analytical information only and does not constitute investment advice or a recommendation to buy or sell any instrument. You are responsible for your own decisions, risk management, and compliance with local regulations.
Elliott Wave, Market Structure, Technical Analysis, Probability, Statistical Analysis, Swing Trading, Risk Management, Decision Support
Summary
Customer reviews
5 | 100 % | |
4 | 0 % | |
3 | 0 % | |
2 | 0 % | |
1 | 0 % |


