

present
Daftar dan dapatkan potongan bernilai $50 untuk pembelian pertama anda
Trading product for MyZTrade High TF candle v1.0 Indikator Inside Bar Engulfing, image 1
MyZTrade High TF candle v1.0
Indikator
Versi 1.0, Aug 2026
Windows, Mac
Trading product for MyZTrade High TF candle v1.0 Indikator Inside Bar Engulfing, image 2
Sejak 28/06/2025

Penerangan

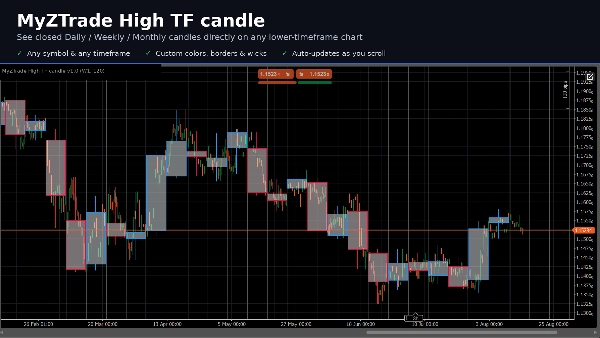
MyZTrade High TF candle adalah alat visualisasi pelbagai jangka masa yang meletakkan lilin jangka masa lebih tinggi yang telah selesai (Harian, Mingguan atau Bulanan — boleh dipilih) terus pada carta semasa anda sebagai kotak berwarna dengan badan, sempadan dan sumbu tinggi/rendah, serupa dengan melihat lilin D1 atau W1 tanpa menukar carta.

Hanya lilin jangka masa lebih tinggi yang telah ditutup yang dilukis. Lilin yang masih terbentuk sengaja diabaikan, jadi kotak tidak pernah berubah bentuk semasa tempohnya masih terbuka — ia hanya muncul setelah tempoh itu benar-benar ditutup.

Jenis penunjuk: lapisan pelbagai jangka masa / alat konteks tindakan harga. Berfungsi pada mana-mana simbol dan mana-mana jangka masa lebih rendah (contoh: M15, H1, H4).

Ciri utama:

  • Jangka masa lebih tinggi boleh dipilih: Harian, Mingguan atau Bulanan
  • Bilangan kotak yang kelihatan boleh dikonfigurasikan, supaya beban carta kekal terkawal pada sejarah panjang
  • Warna isian dan sempadan berasingan untuk lilin bullish dan bearish
  • Sumbu tinggi/rendah pilihan pada setiap kotak
  • Secara automatik melukis semula apabila anda menatal carta

Kegunaan perdagangan: baca zon sokongan/rintangan jangka masa lebih tinggi dan bias harian atau mingguan semasa melaksanakan pada jangka masa lebih rendah, dan kaji bagaimana harga berkelakuan di dalam julat jangka masa lebih tinggi yang telah selesai tanpa menukar carta ke depan dan ke belakang.

Ringkasan

Ringkasan AI
MyZTrade High TF candle is a multi-timeframe visualization indicator designed to overlay completed higher-timeframe candles—Daily, Weekly, or Monthly—directly onto a lower timeframe chart (e.g., M15, H1, H4). It displays these higher timeframe candles as colored boxes with distinct bodies, borders, and optional high/low wicks, providing a clear view of higher timeframe price action without switching charts. Only fully closed higher timeframe candles are shown, ensuring that the displayed boxes remain static and do not change shape during the current period. Users can configure the number of visible boxes to manage chart load and customize separate fill and border colors for bullish and bearish candles. The indicator automatically redraws when scrolling the chart. This tool aids traders in identifying higher timeframe support and resistance zones and assessing daily or weekly market bias while executing trades on lower timeframes. It supports any symbol and serves as a price-action context tool for enhanced multi-timeframe analysis.
Profil indikator

Ulasan pelanggan

0.0
Ulasan: 0
Ulasan pelanggan
Belum ada ulasan untuk produk ini. Anda sudah mencuba produk tersebut? Jadilah yang pertama untuk berkongsi pendapat anda!

Perbincangan

Soalan Lazim

Inside Bar
Engulfing
Fair Value Gap
BOS
Imbalance
CHOCH
Support & Resistance
Produk yang tersedia melalui cTrader Store, termasuk bot dagangan, indikator dan plugin, disediakan oleh pembangun pihak ketiga dan diberikan akses untuk tujuan maklumat dan teknikal sahaja. cTrader Store bukan broker dan tidak memberikan nasihat pelaburan, syor peribadi atau sebarang jaminan prestasi masa hadapan.

Lebih banyak produk daripada penulis ini

Indikator
Volume
Key Levels
+4
Margin Zones its CME-based support/resistance levels from price extremes, helps traders spot entries and exits NKZ zones
Indikator
Channel
Fibonacci
+5
Market maker levels from key price extremes — catch major reversals and corrections in one click. ver1.2
Indikator
ATR
EMA
+5
The indicator displays potential reversal zones (support/resistance) on the chart based on the average range (High–Low)

Anda juga mungkin suka

Indikator
RSI
Signal
+2
Dynamic circles visualize price's volatility position. Like RSI for market overextension & stretch. Quantify context.
Indikator
Smoothed CCI alerts! Audio & arrow signals for +/-100 crosses. Custom sounds & arrow filters. Precision trading!
Indikator
Forex
BTCUSD
+12
🎯Automatically identifies the market's significant turning points (key H & L) and draws dynamic support and.....✍️
Indikator
RSI
MACD
Unlock market insights with our Multi-Timeframe Market Levels indicator, enhancing your trading strategies effortlessly
Indikator
RSI
Indicator Stochastic With RSI
Indikator
BOS
MSS
+5
Your entire ICT session map, structure engine, and key levels — No manual work. One indicator. Every session!
Indikator
AI
ATR
+20
Buy and Sell Signals
Indikator
Forex
cTrader ZigZag Alerts: Precision Swing Detection, Alerts, and Fibonacci.
Indikator
Indices
Custom ADX Indicator for precise trend analysis. المؤشر المخصص ADX لتحليل الاتجاه بدقة
Indikator
BOS
Key Levels
+1
Guided by Yahuah Yahusha. 15M: BOS above red (buys)/below green (sells). 4HC reject+BOS. 5M: RBS/SBR. SL wick. TP 1:4.
Indikator
Key Levels
Order Block
+5
Pixel-perfect trading zones in a click! Instantly draw, resize & color via hotkeys. Automate your charting routine
Indikator
Volume
Order Block
+4
Advanced Pro Volume Profile: Double Back-to-Back, Institutional Dynamic, Fixed Range & Order Flow
Indikator
Prop
Forex
+4
Universal multi time frame 'Moving Average' indicator with extended features
Indikator
MSS
Key Levels
+2
Fractal based market structure indicator that identifies HH, HL, LH, and LL pivot with confirmed, non-repainting fractal
Indikator
ADX
ATR
+1
Indicador de Sinais Visuais para Spotcrude (WTI) ou SpotBrent com filtros de tendência, operacional de 10 e 15 minutos.
Indikator
ATR
RSI
+19
Multi-timeframe heatmap scoring Direction, Strength & Volatility at a glance!
Indikator
Drawdown Monitor
Proprietary trading desk risk monitoring dashboard!
Indikator
Prop
Forex
NEW - PNLs as % - daily, weekly, monthly, or yearly & Spread, Time To Close, PNL Alerts, custom Bid / Ask lines

Harga

Sejak 28/06/2025




















