
설명
📊 TrendHeikinMultiMA – 고급 추세 알고리즘
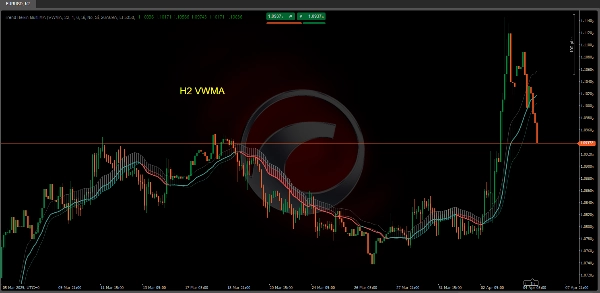
이 TrendHeikinMultiMA 알고리즘은 가격 데이터에서 추세 값을 계산하도록 설계되었으며, 이를 부드럽게 하기 위해 Heikin-Ashi 공식을 사용하고 다양한 유형의 이동 평균(ALMA, HMA, SMA, SWMA, VWMA, WMA, ZLEMA, 또는 EMA)을 적용합니다.
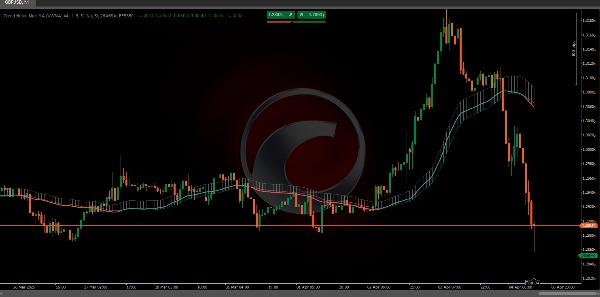
비록 Heikin-Ashi 값이 내부적으로 사용되지만, 차트는 전통적인 Heikin-Ashi 캔들을 표시하지 않습니다. 대신 부드럽게 처리된 값을 기반으로 추세선을 그려 캔들스틱 차트의 시각적 복잡성 없이 시장 방향을 더 쉽게 해석할 수 있게 합니다.
🔄 1. 부드럽게 처리의 역할
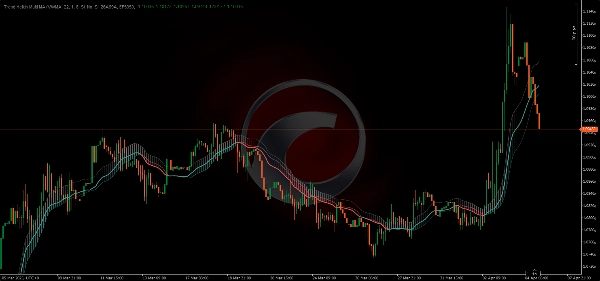
추세 값이 Heikin-Ashi 부드럽게 처리와 이동 평균을 결합하여 도출되기 때문에, TrendHeikinMultiMA에서 가격이 추세선을 교차할 때 색상 변경이 즉시 발생하지 않습니다:
- 🔹 가격이 일시적으로 추세선의 위나 아래로 움직일 수 있지만, 색상 변경을 유발하지 않을 수 있습니다.
- 🔹 이는 지표가 실제 추세 반전을 확인하기 위해 중요하고 지속적인 부드럽게 처리된 시가와 종가 값 간의 차이를 기다리기 때문입니다.
✅ 해석상의 장점
이 의도적인 지연은 거짓 신호를 피하는 데 도움을 줍니다. 전통적인 캔들스틱 차트에서는 가격이 잠시 추세선을 넘어서 조기 신호를 유발할 수 있습니다.
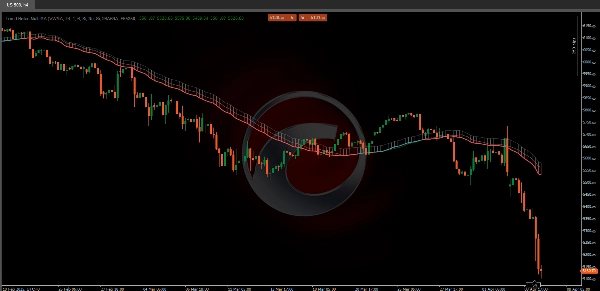
- 🟥 예를 들어, 현재 가격이 약세 추세선 위에 있더라도, 지표는 부드럽게 처리된 값이 종가가 시가보다 지속적으로 높다는 것을 확인할 때까지 빨간색(약세) 상태를 유지합니다.
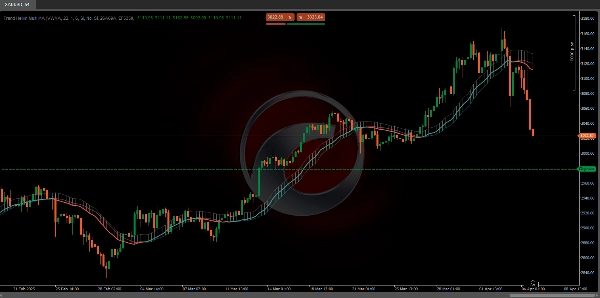
- 🟩 마찬가지로, 녹색(강세)으로 전환하려면 Heikin-Ashi 기반 이동 평균이 종가가 시가를 지속적으로 초과한다는 것을 확인해야 합니다.
📈 2. Heikin-Ashi 값에 이동 평균 적용하기
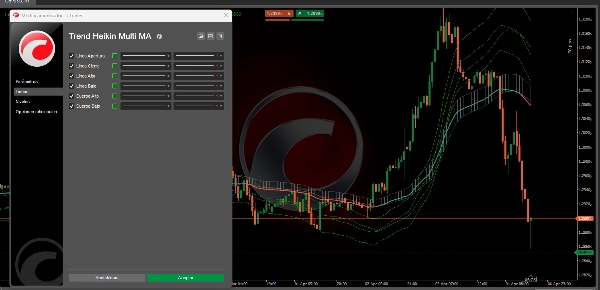
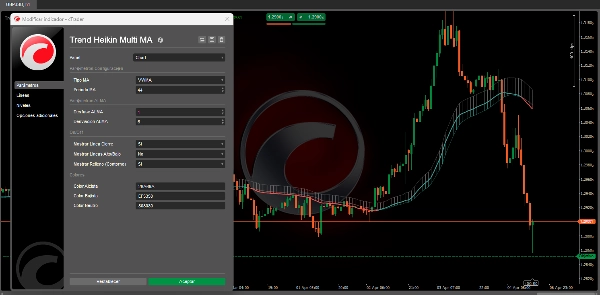
- 🔄 이동 평균 선택:
-
- 사용자는 여러 이동 평균 유형 중에서 선택할 수 있습니다 (ALMA, HMA, SMA, SWMA, VWMA, WMA, ZLEMA, 및 EMA).
- 각 이동 평균 유형은 특정 수학적 방법을 적용하여 Heikin-Ashi에서 파생된 시가, 종가, 고가, 저가의 과거 값을 가중치 부여하고 부드럽게 처리합니다.
🏆 3. TrendHeikinMultiMA와 전통적 캔들스틱의 장점 비교
- 📉 노이즈 감소:
-
- 전통적인 캔들스틱은 종종 높은 변동성과 산재된 데이터를 보여주어 전체 추세를 파악하기 어렵게 만듭니다.
- TrendHeikinMultiMA는 이 데이터를 부드럽게 처리하여 작은 변동을 걸러내고 급격한 변동을 제거하여 트레이더가 주요 시장 방향에 집중할 수 있도록 합니다.
✅ 결론
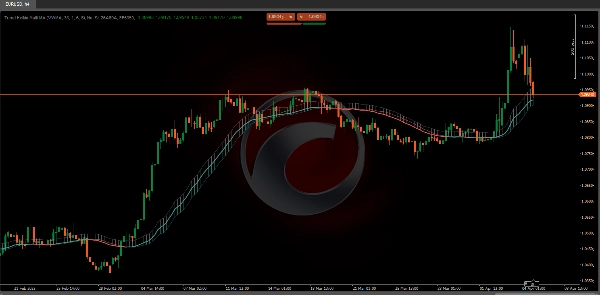
요약하자면, TrendHeikinMultiMA는 선택된 이동 평균을 통해 처리된 Heikin-Ashi에서 계산된 부드럽게 처리된 시가와 종가 값이 일관되게 시장 행동이 방향을 전환했음을 보여줄 때만 추세 변화(강세 또는 약세)를 확인합니다.
이로 인해 신호가 더 신뢰할 수 있고 전통적인 캔들스틱 차트에서 보이는 노이즈의 영향을 덜 받습니다. 🚀📊
🔥 Pinescritlabs Ctrader 스토어 지표 🔥
Dynamic Market Structure
Turning Points 분석
Fibonacci Linear
Regression 다중 타임프레임
Multi-Level Candle Bias
Tracker
Auto Support and
Resistance Trend Lines
All Support and
Resistance Levels
요약
고객 리뷰
5 | 33 % | |
4 | 67 % | |
3 | 0 % | |
2 | 0 % | |
1 | 0 % |


