
คำอธิบาย
Pinescritlabs
Ctrader Store indicators: 🤖Pinescritlabs Ctrader Store cBots:
Fair Value Gap Sessions Gold & BTC Breakout Session Pivots(new)
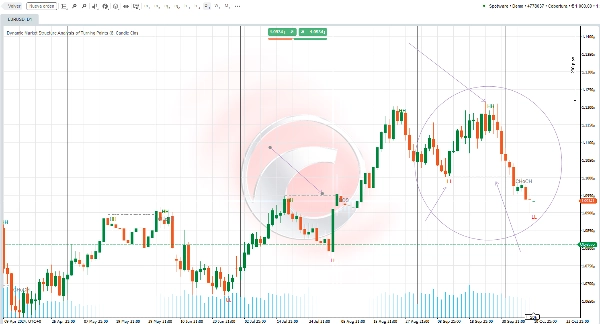
Dynamic Market Structure
Analysis of Turning Points
Fibonacci Linear
Regression Multi-timeframe
Multi-Level Candle Bias
Tracker
Auto Support and
Resistance Trend Lines
All Support and
Resistance Levels
ภาพรวมการตั้งค่าอินดิเคเตอร์ 🌟
SWING LENGTH 📏
พารามิเตอร์นี้กำหนดจำนวนแท่งเทียนที่พิจารณาทางซ้ายและขวาเมื่อค้นหาจุดสวิง ค่าที่ต่ำกว่าจะทำให้แสดงจุดมากขึ้น ในขณะที่ค่าที่สูงกว่าจะลดจำนวนจุดลง แนะนำให้ปรับพารามิเตอร์นี้ตามสไตล์การเทรดของคุณและเมื่อสลับระหว่างกรอบเวลาต่างๆ
CHOCH 🔄
การเปิดใช้งานตัวเลือกนี้จะเปลี่ยนชื่อการเบรคเอาท์แนวโน้มตรงข้ามครั้งแรกเป็น CHoCH (Change of Character) ซึ่งบ่งชี้ถึงความเป็นไปได้ของการเปลี่ยนแปลงทิศทางตลาด
HH and LL 📈📉
อินดิเคเตอร์จะแสดงจุดสูงสุดสวิง (HH) และจุดต่ำสุดสวิง (LL) บนกราฟ ช่วยให้คุณเห็นโครงสร้างตลาดได้ชัดเจนขึ้น
BOS ⚡
อินดิเคเตอร์จะแสดงระดับ Break of Structure (BOS) เมื่อพบการเบรคเอาท์ที่จุดสวิง ให้ข้อมูลเชิงลึกเพิ่มเติมเกี่ยวกับพลวัตของตลาด
สรุป
รีวิวจากลูกค้า
5 | 33 % | |
4 | 67 % | |
3 | 0 % | |
2 | 0 % | |
1 | 0 % |


