
Mô tả
QX SmartStructure (QX SS)
QX SmartStructure (QX SS) là một lớp phủ SMC nhẹ, cạnh phải cứng cho cTrader. Nó hiển thị cấu trúc hiện tại, các đột phá BOS/CHoCH, các vùng FVG được lọc + tự động quản lý, và một bảng thiên hướng MTF H1/H4 nhỏ gọn để bạn không phải chuyển đổi khung thời gian.
Chỉ là công cụ trực quan hóa. Nó không thực hiện giao dịch.
Những gì nó hiển thị
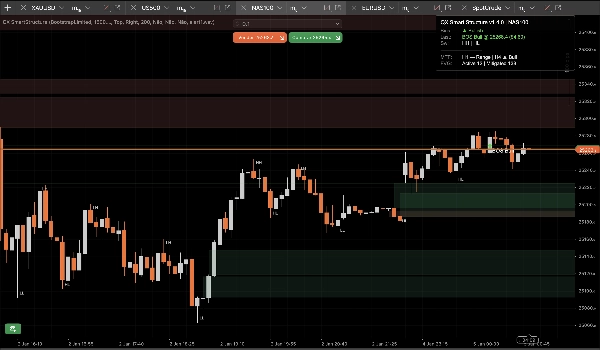
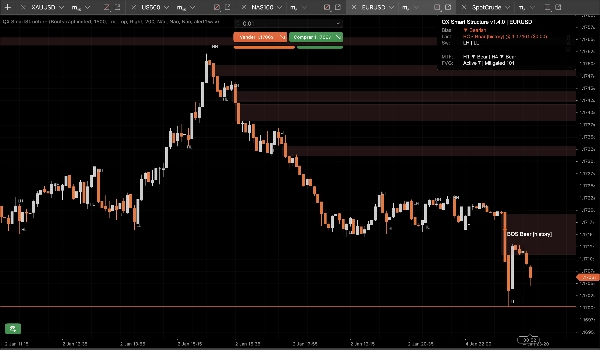
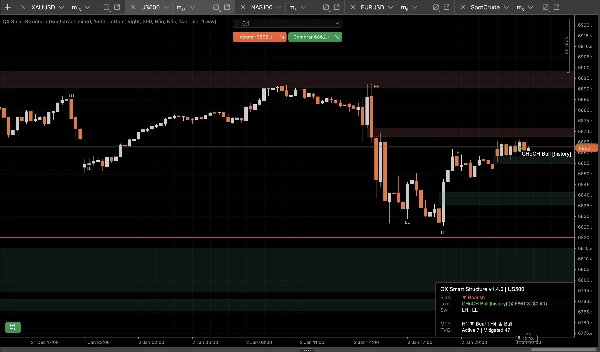
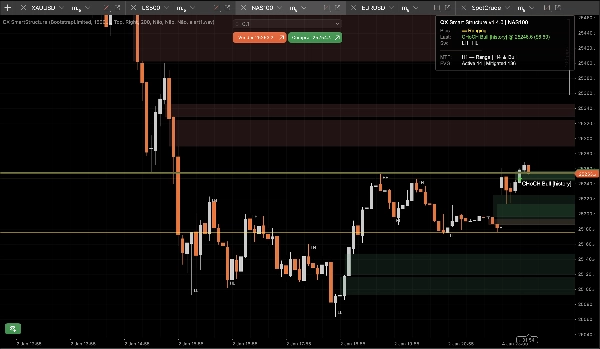
1) Cấu trúc thị trường sạch (Cạnh phải cứng)
- Nhãn swing: HH / HL / LH / LL
- Các mức chính: đỉnh swing được xác nhận cuối cùng và đáy swing được xác nhận cuối cùng
- Sự kiện phá vỡ: BOS / CHoCH với độ mạnh (Mạnh vs Yếu)
- Chế độ hiển thị:
-
- Chỉ hoạt động (tối thiểu)
- Swing gần đây (ngữ cảnh được kiểm soát)
2) Các vùng FVG được kiểm soát
- Hình chữ nhật FVG tăng và giảm
- Kích thước FVG tối thiểu (bước) bộ lọc tự động loại bỏ các khe hở nhỏ
- Quy tắc giảm nhẹ 50% (dựa trên bấc nến): một vùng được giảm nhẹ khi giá đạt đến mức giữa của nó
- Vòng đời:
-
- Tự động ẩn vùng giảm nhẹ = BẬT để biểu đồ sạch nhất
- TẮT giữ các vùng giảm nhẹ như ngữ cảnh “ma” (độ mờ thấp hơn)
- Giới hạn cứng ngăn chặn spam đối tượng trong các phiên dài (lưu trữ/vẽ/kéo dài sang phải)
3) Bảng thiên hướng MTF (H1 / H4)
Một bảng nhỏ gọn hiển thị:
- Thiên hướng khung thời gian hiện tại: Tăng / Giảm / Dao động / Không rõ
- Sự kiện cuối cùng: BOS/CHoCH, hướng, độ mạnh
- Ảnh chụp tùy chọn: Thiên hướng H1 và Thiên hướng H4
4) Cảnh báo âm thanh tùy chọn
Cảnh báo chỉ âm thanh cho các đột phá, với:
- Tùy chọn cảnh báo khi đột phá yếu
- Tên tệp âm thanh tùy chỉnh
Ưu điểm StepSize (FX, Vàng, Chỉ số)
Hầu hết các công cụ cấu trúc bị lỗi khi bạn chuyển đổi ký hiệu vì chúng giả định “pips” có nghĩa giống nhau ở mọi nơi.
QX SS sử dụng StepSize như một đơn vị chung: TickSize → PipSize → Digits dự phòng
Chuyển đổi bất kỳ khoảng cách nào thành bước
bước = khoảng cách_giá ÷ TickSize
Ví dụ (kích thước tick phổ biến):
- EURUSD TickSize 0.00001: 1 pip (0.00010) = 10 bước
- XAUUSD TickSize 0.01: $0.10 = 10 bước, $1.00 = 100 bước
- Chỉ số thay đổi theo nhà môi giới:
Nơi tìm TickSize
- Trong cTrader Automate: Symbol.TickSize (QX SS đọc nó một cách an toàn)
- Trong giao diện nền tảng: bảng thông số ký hiệu (thông tin ký hiệu trong Market Watch)
Kích thước FVG tối thiểu được khuyến nghị (bước)
Đây là phạm vi bắt đầu thực tế, không phải sự thật phổ quát. Biến động và phiên giao dịch quan trọng.
M15 (quy trình mặc định)
- EURUSD: 20–40 bước (≈ 2–4 pips nếu TickSize = 0.00001)
- XAUUSD: 30–120 bước (≈ $0.30–$1.20 nếu TickSize = 0.01)
- US500 / NAS100: chọn một chuyển động có ý nghĩa theo điểm, sau đó chuyển đổi:
M5 (đúng, nó thay đổi)
M5 tạo ra nhiều khe hở nhỏ hơn. Nếu bạn giữ cùng MinFVGSteps, bạn sẽ lọc quá nhiều.
Điều chỉnh điển hình: giảm MinFVGSteps khoảng 30–50% so với giá trị M15 của bạn, sau đó điều chỉnh lại.
“Dao động” không phải là lỗi!
Thiên hướng trở thành Dao động khi các đỉnh/đáy swing gần đây không sắp xếp rõ ràng như HH+HL hoặc LH+LL.
Trong trạng thái lộn xộn, một công cụ luôn giữ “Tăng” là không trung thực. QX SS được thiết kế thận trọng.
Cài đặt sẵn (điểm bắt đầu)
Cài đặt sẵn A: “M15 Cân bằng” (mặc định được khuyến nghị)
- Độ mạnh Swing (M15=7): 7
- Loại đột phá: Đóng cửa
- Chỉ xác nhận: đúng
- Chế độ hiển thị: Swing gần đây
- Số lượng Swing gần đây: 30
- Kích thước FVG tối thiểu (bước): EURUSD 25 | XAUUSD 60 | Chỉ số 15 (sau đó điều chỉnh)
- Tự động ẩn vùng giảm nhẹ: đúng
- Số lượng FVG tối đa được vẽ: 30
- Kéo dài thanh sang phải: 50
- Hiển thị MTF H1: đúng
- Hiển thị MTF H4: đúng
Cài đặt sẵn B: “M15 Biểu đồ sạch”
- Chế độ hiển thị: Chỉ hoạt động
- Hiển thị nhãn Swing: sai
- Tự động ẩn vùng giảm nhẹ: đúng
- Số lượng FVG tối đa được vẽ: 15–20
- (Giữ phần còn lại từ Cài đặt sẵn A)
Cài đặt sẵn C: “Ngữ cảnh scalp M5”
- Độ mạnh Swing: 5–6
- Loại đột phá: Bất kỳ
- Chỉ xác nhận: đúng (bắt đầu nghiêm ngặt)
- Hiển thị đột phá yếu: sai
- Kích thước FVG tối thiểu (bước): ~50–70% của giá trị M15 của bạn
- Số lượng Swing gần đây: 20–30
- Kéo dài thanh sang phải: 30–50
Tích hợp cBot / tự động hóa (những gì QX SS cung cấp)
QX SmartStructure cung cấp 3 chuỗi nội bộ cho cBots:
- BiasSeries: 1 tăng, -1 giảm, 0 khác
- BreakSignalSeries: 1 đột phá tăng, -1 đột phá giảm, 0 khác
- BreakLevelSeries: mức giá trên thanh sự kiện, NaN nếu không (điểm đánh dấu sạch)
Độ ổn định và hiệu suất (v1.5.1+)
Thiết kế cho các thiết lập đa biểu đồ và các phiên dài:
- Chỉ xử lý trên các thanh đóng mới
- Cập nhật giao diện người dùng được giới hạn bởi UI Throttle (ms) để giữ CPU thấp
- Số lượng đối tượng được kiểm soát và giới hạn cắt tỉa ngăn chặn spam biểu đồ
- Phát hiện “tải lại cứng” thực sự một cách an toàn (tải lại khung thời gian/ký hiệu/lịch sử) và xây dựng lại trạng thái mà không bị lệch
Tùy chọn an toàn mới (v1.5.1+)
Vô hiệu hóa khi nhảy Gap (mặc định BẬT)
Nếu giá nhảy gap và nhảy qua một vùng FVG mà không chạm vào nó (mở cửa cuối tuần/tin tức), vùng đó được đánh dấu Vô hiệu hóa do Gap thay vì giữ trạng thái hoạt động.
Điều này ngăn các vùng cũ còn lại trên biểu đồ sau các phiên mở cửa dữ dội.
Xóa toàn bộ chuỗi khi xây dựng lại (mặc định TẮT)
Khi xây dựng lại cứng, tùy chọn xóa toàn bộ lịch sử của các chuỗi đầu ra được cung cấp để đảm bảo tính nhất quán tối đa khi kiểm tra lại/xuất dữ liệu.
Giữ TẮT để có hiệu suất tốt nhất trên lịch sử lớn. Bật BẬT chỉ cho các quy trình kiểm tra lại sâu cần tính toàn vẹn lịch sử đầy đủ.
Mặc định được khuyến nghị
- Vô hiệu hóa khi nhảy Gap: Có (BẬT)
- Xóa toàn bộ chuỗi khi xây dựng lại: Không (TẮT)
Tuyên bố từ chối trách nhiệm
Công cụ này chỉ dùng để trực quan hóa và hỗ trợ quyết định. Giao dịch có rủi ro. Luôn sử dụng quản lý rủi ro của riêng bạn.
Tóm tắt
It automatically detects and manages Fair Value Gap (FVG) zones, filtering out micro-gaps based on a configurable minimum size measured in steps, a universal unit derived from the symbol’s TickSize. The indicator applies a 50% mitigation rule to mark zones as mitigated when price reaches their midpoint, with options to auto-hide or display mitigated zones as ghosted.
QX SmartStructure includes a compact multi-timeframe (MTF) bias panel showing current timeframe bias (Bullish, Bearish, Ranging, or Unknown) and recent break events for H1 and H4 timeframes. Optional sound alerts notify users of break events, including weak breaks.
The tool supports various markets such as Forex, commodities (e.g., gold), indices, and cryptocurrencies by adapting to symbol-specific TickSize values. It exposes internal data series for integration with cBots and is optimized for performance with controlled object counts and throttled updates. The indicator does not place trades and is intended for decision support only.
Đánh giá của khách hàng
5 | 100 % | |
4 | 0 % | |
3 | 0 % | |
2 | 0 % | |
1 | 0 % |


![Logo "[Stellar Strategies] Market Session Ultimate"](https://cdn.ctrader.com/image/webp/61ffd537-0125-4246-9e72-42eca1791d64_28232)


