
Deskripsi
QX PivotZones adalah indikator Pivot Points yang dibuat untuk keputusan perdagangan nyata, bukan hanya garis statis yang diabaikan harga"
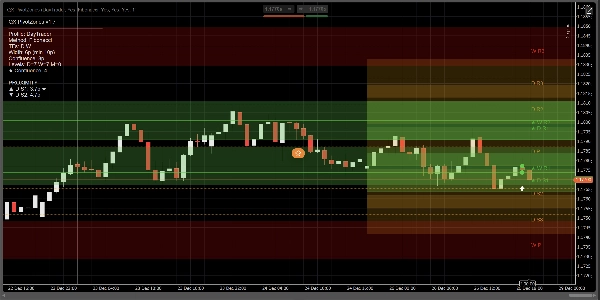
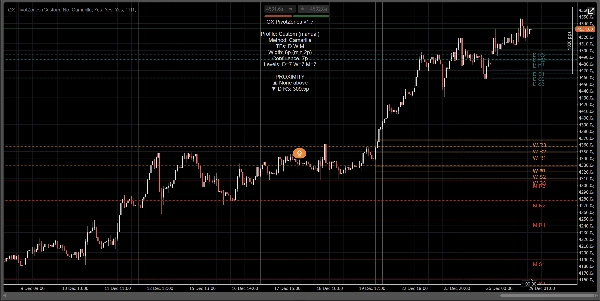
Ini menghitung pivot Harian, Mingguan, dan Bulanan menggunakan Classic, Fibonacci, Camarilla, atau Woodie, dan menggambarnya sebagai zona harga nyata (pita) dengan lebar yang dapat disesuaikan (Pips atau berbasis ATR). Keunggulan utamanya sederhana: secara otomatis menyoroti konfluensi multi-timeframe dan mengubah pivot menjadi area yang dapat ditindaklanjuti, bukan “fantasi garis sempurna”.
Mengapa ini berbeda dari alat Fibonacci Pivot / FiboPoints biasa:
Sebagian besar indikator “FiboPoints” berhenti pada garis pivot dasar. QX PivotZones menambahkan apa yang sebenarnya dibutuhkan trader:
- Deteksi Konfluensi D/W/M Otomatis: ketika pivot dari timeframe berbeda berkumpul, level tersebut disorot (★) dan dicat menggunakan warna konfluensi.
- Zona (Pita) bukan garis tipis: tentukan lebar dalam pips atau ATR. Ini mengurangi noise dari reaksi “hampir menyentuh”.
- Filter Level Terdekat (opsional): hanya tampilkan zona yang paling relevan di atas dan di bawah harga saat ini.
- Peringatan Berguna: memicu pada Masuk Zona, Sentuh Garis, atau Keduanya, dengan cooldown dan penyaringan opsional “Hanya Konfluensi”.
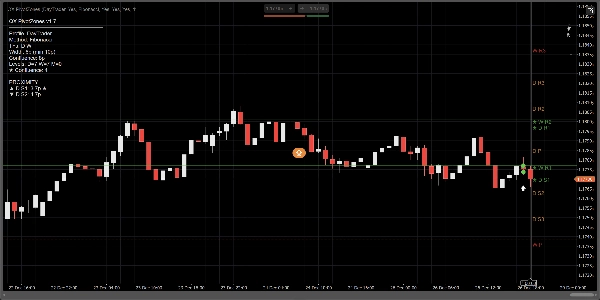
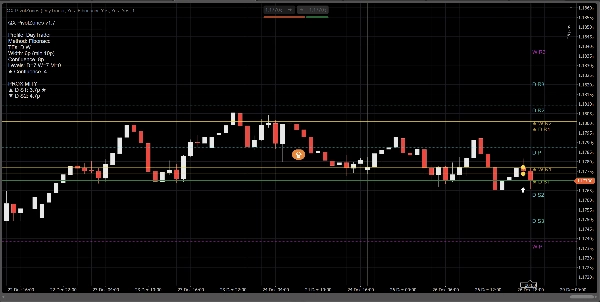
- Panel Info + Kedekatan: lihat TF yang diaktifkan, metode, lebar zona, jumlah konfluensi, dan jarak ke zona terdekat di atas/bawah.
Cara menggunakan:
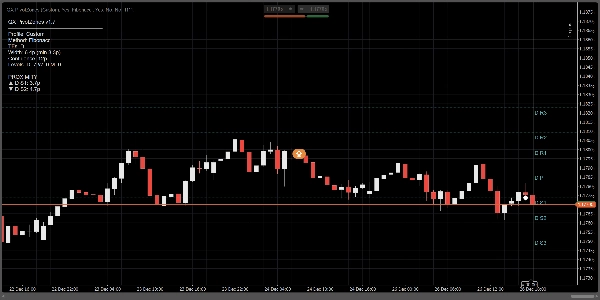
1) Pilih profil
- Scalper: intraday, lebih sedikit level, zona adaptif yang lebih ketat.
- DayTrader: Harian + Mingguan (default).
- Swing: Harian + Mingguan + Bulanan.
- Custom: kontrol manual atas semuanya.
Tip: Jika Anda ingin “DayTrader + Bulanan”, nonaktifkan override profil (atau gunakan Custom) dan aktifkan Tampilkan Bulanan secara manual.
2) Konfigurasikan zona (inti dari semuanya)
Di bawah Mode Lebar Zona:
- Pips untuk pita yang tetap dan konsisten.
- ATR untuk pita yang adaptif terhadap volatilitas.
Parameter utama:
- Lebar Zona (pips) atau ATR k
- Lebar Zona Minimum (pips) untuk menghindari pita menjadi terlalu tipis
- Isi Zona untuk mewarnai zona
- Perpanjang Zona ke Kanan untuk memproyeksikan pita ke sisi kanan yang terlihat
3) Aktifkan Konfluensi (pembeda utama)
- Sorot Konfluensi: AKTIF
- Mode Konfluensi:
-
- Pips untuk toleransi tetap
- ATR untuk toleransi adaptif
- Jarak Konfluensi atau Konfluensi ATR k
Level konfluensi mendapatkan:
- Warna konfluensi
- penanda ★ pada label
- Jumlah yang ditampilkan di panel
4) Peringatan (berdagang tanpa harus menatap layar)
- Peringatan: MasukZona, SentuhGaris, atau Keduanya
- Peringatan: Hanya Konfluensi: mengurangi noise
- Cooldown Peringatan (bar): mencegah spam
- Tampilkan Ikon Peringatan: menandai kejadian di grafik
Preset pengaturan cepat (disarankan)
Scalping (M5–M15)
- Mode Lebar Zona: ATR
- ATR k: 0.15–0.25
- Mode Konfluensi: Pips
- Jarak Konfluensi: 4–8 pips
- Hanya Zona Terdekat: AKTIF (3 atas / 3 bawah)
Perdagangan Harian (M15–H1)
- Mode Lebar Zona: Pips
- Lebar: 6–10 pips
- Konfluensi: 8–12 pips
- Aktifkan Harian + Mingguan
Swing (H4–D1)
- Mode Lebar Zona: ATR
- ATR k: 0.25–0.45
- Aktifkan Harian + Mingguan + Bulanan
Apa yang dilakukan (dan tidak dilakukan)
- Ini bukan generator sinyal beli/jual.
- Ini adalah peta struktur pasar / zona S&R dengan peringatan kejadian (masuk/sentuh) dan penyorotan konfluensi.
- Kasus penggunaan terbaik: reaksi pada pivot, penolakan/penerimaan, pullback, target, scaling out, dan perlindungan perdagangan.
Ringkasan
Ulasan pelanggan
5 | 100 % | |
4 | 0 % | |
3 | 0 % | |
2 | 0 % | |
1 | 0 % |


