
Mô tả
Giới thiệu Biểu đồ MACD Histogram được cải tiến, được thiết kế để mang lại trải nghiệm giao dịch rõ ràng và sâu sắc hơn.
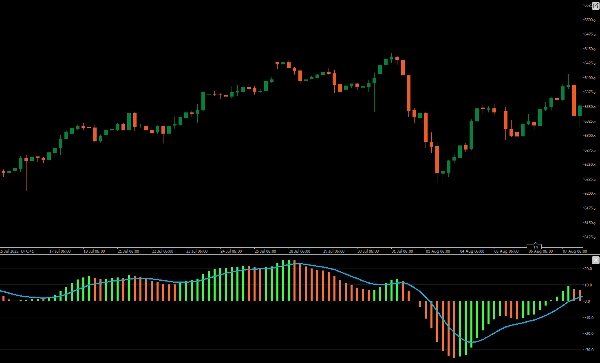
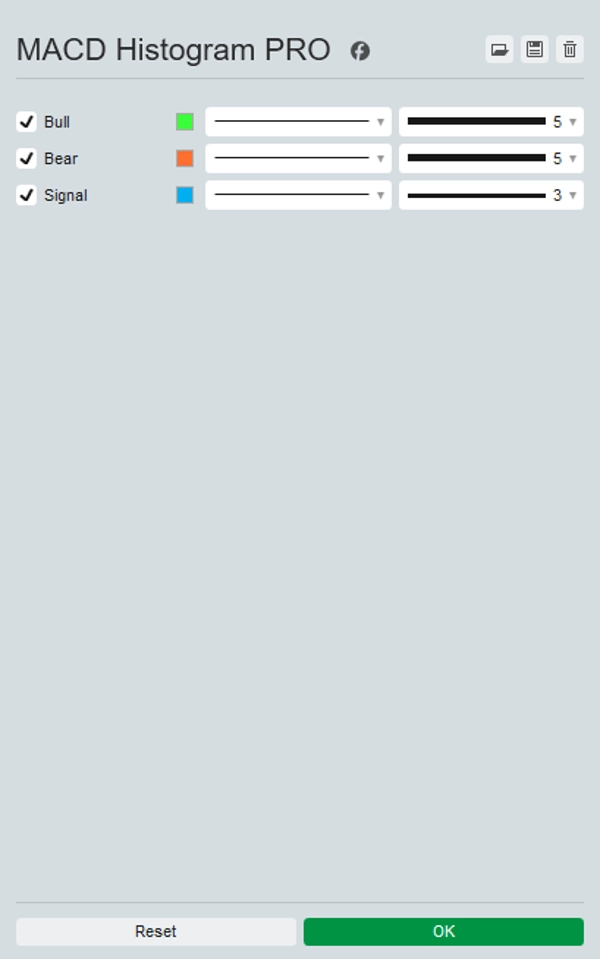
Chỉ báo nâng cấp này hiển thị một biểu đồ màu sắc sống động phân biệt giữa các biến động giá tăng và giảm, vượt ra ngoài định dạng màu đơn mặc định. Bằng cách sử dụng các màu sắc khác nhau cho các chuyển động tích cực và tiêu cực, nó cung cấp một tín hiệu thị giác ngay lập tức về điều kiện thị trường, giúp dễ dàng hơn trong việc diễn giải sự thay đổi động lượng và khả năng đảo chiều xu hướng.
Hoàn hảo cho các nhà giao dịch tìm kiếm sự rõ ràng và chính xác nâng cao, bản nâng cấp Biểu đồ MACD Histogram này biến biểu đồ của bạn thành một công cụ phân tích mạnh mẽ hơn. Nâng cao chiến lược giao dịch của bạn với Biểu đồ MACD Histogram được cải tiến.
Tóm tắt
Đánh giá của khách hàng
5 | 50 % | |
4 | 50 % | |
3 | 0 % | |
2 | 0 % | |
1 | 0 % |


