
Deskripsi
🔧 ATR_RR_SignalPanel — Deskripsi Teknis & Detail (EN) 🧠📈
ATR_RR_SignalPanel adalah sebuah indikator overlay untuk cTrader yang menghasilkan sinyal masuk perubahan tren menggunakan regime EMA Cepat vs EMA Lambat, kemudian membangun sebuah kerangka perdagangan virtual lengkap (Masuk 🏁, Stop Loss 🛑, Take Profit Akhir 🎯, Target Menengah 🟢) menggunakan penentuan risiko berbasis ATR dan sebuah pengali Risk:Reward yang dapat dikonfigurasi ⚖️.
🧭 Logika Inti (Mesin Sinyal) 🚦
- Indikator menghitung:
-
- EMA Cepat ⚡ dan EMA Lambat 🐢 pada Close.
- ATR (perataan Wilder) 🌡️ untuk jarak stop berbasis volatilitas.
- Sebuah regime tren didefinisikan sebagai:
-
- Tren bullish 🟢 ketika
Fast EMA > Slow EMA - Tren bearish 🔴 ketika
Fast EMA < Slow EMA
- Tren bullish 🟢 ketika
- Sebuah Perubahan Tren 🔁 terjadi ketika status bullish/bearish berbeda dari bar sebelumnya (setara dengan Pine’s
bullTrend != bullTrend[1]).
🎯 Kondisi Masuk (BELI/JUAL) 🟩🟥
Ketika terjadi perubahan tren:
- Sinyal BELI 🟢 jika:
-
- Tren bullish aktif dan perubahan tren terdeteksi
- Konfirmasi candle opsional ✅: Close > Open (candle bullish)
- Sinyal JUAL 🔴 jika:
-
- Tren bearish aktif dan perubahan tren terdeteksi
- Konfirmasi candle opsional ✅: Close < Open (candle bearish)
🧪 Manajemen Posisi Virtual (Bukan cBot) 🧩
Indikator ini tidak menempatkan order. Sebagai gantinya, ia mensimulasikan “posisi virtual” internal:
- Pada sinyal BELI/JUAL baru, ia menetapkan:
-
- Harga Masuk = close saat ini 🏁
- Stop Loss = ekstrem candle ± ATR × pengali 🛑
- Take Profit Akhir = Masuk ± (Risiko × RiskReward) 🎯
- Level TP Menengah = langkah pada 1R, 2R, … sampai floor(RR)-1 🟢
- Ia memantau aksi harga bar demi bar:
-
- Jika TP akhir tersentuh ➜ menandai 🎯 dan menutup posisi virtual ✅
- Jika SL tersentuh ➜ menandai 🛑 dan menutup posisi virtual ❌
- Hit TP menengah dilacak hanya sekali 🧷
🔁 Logika Pembatalan (Sinyal Berlawanan Saat Aktif) ⚠️
Jika sinyal baru datang saat posisi virtual berlawanan masih ada:
- Entri sebelumnya ditandai sebagai DIBATALKAN ⚠️ (INV BELI / INV JUAL)
- Posisi virtual sebelumnya dihentikan 🧯
- Posisi virtual baru dibuat ke arah baru 🔄
🧼 Aman Multi-Instansi (Beberapa Salinan di Grafik Sama) 🧩🧩
Setiap instansi indikator menghasilkan ID internal unik 🆔, sehingga:
- Garis/teks dari satu instansi tidak akan menimpa instansi lain ✅
- Anda dapat menjalankan beberapa konfigurasi secara paralel (misal, scalping + swing) 🧠📊
🧯 Kontrol Anti-Kekacauan (Pembatas Marker) 🧹✨
Untuk menjaga grafik tetap terbaca, dapat:
- Membatasi jumlah marker teks yang digambar (BELI/JUAL/TP/SL/INV/TP1…) 🧾
- Menghapus marker lama secara otomatis saat batas terlampaui ♻️
🧷 Opsi “Pertahankan Garis Risiko Terakhir” 🧠📌
Saat diaktifkan, garis Entry/SL/TP terakhir tetap terlihat meskipun TP/SL sudah tertutup:
- Bagus untuk tinjauan pasca-perdagangan 🧑🔬
- Bagus untuk pencatatan jurnal 📒✅
⚙️ Parameter — Penjelasan Detail (EN) 🔍📌
📈 Inti Sinyal & Risiko
⚡ EMA Cepat
- Fungsinya 🧠: Menetapkan periode EMA cepat yang digunakan untuk mendeteksi pergeseran regime.
- Efek 📊: Nilai rendah = lebih reaktif ➜ lebih banyak sinyal; nilai tinggi = lebih halus ➜ lebih sedikit sinyal.
- Rentang tipikal 🎛️: 3–10 untuk pasar cepat ⚡, 10–20 untuk pengaturan lebih tenang 🐢
🐢 EMA Lambat
- Fungsinya 🧠: Menetapkan periode EMA lambat yang digunakan sebagai garis dasar tren.
- Efek 📊: EMA lambat lebih tinggi = penyaringan lebih kuat ➜ lebih sedikit pemicu perubahan tren.
- Rentang tipikal 🎛️: 13–55 tergantung gaya 🧭
🌡️ Periode ATR
- Fungsinya 🧠: Mengontrol panjang pengukuran volatilitas untuk ATR.
- Efek 📏: ATR pendek bereaksi cepat (SL lebih ketat), ATR panjang menstabilkan (SL lebih stabil).
- Rentang tipikal 🎛️: 10–21 adalah umum ✅
🛑 Pengali SL (ATR)
- Fungsinya 🧠: Menentukan jarak Stop Loss dalam satuan ATR.
- Long 🟢:
SL = Low - ATR * Mult - Short 🔴:
SL = High + ATR * Mult - Efek 🎯: Pengali lebih tinggi = SL lebih lebar (lebih sedikit stop, risiko lebih besar); lebih rendah = SL lebih ketat (lebih banyak stop).
- Nilai tipikal 🎛️: 0.3–2.0 tergantung volatilitas 🌪️
⚖️ Risk:Reward (R:R)
- Fungsinya 🧠: Mengalikan jarak “risiko” untuk menghitung TP akhir.
- Rumus 📌:
-
- Risiko = |Masuk − SL|
- TP Akhir = Masuk ± Risiko × RR 🎯
- TP Menengah 🟢: TP1 pada 1R, TP2 pada 2R, … sampai
floor(RR)-1 - Contoh 🧪: RR=3 ➜ TP1 (1R), TP2 (2R), TP Akhir (3R) 🎯🎯🎯
✅ Memerlukan konfirmasi candle
- Fungsinya 🧠: Menambahkan validasi arah candle pada bar sinyal.
- BELI 🟢: memerlukan Close > Open
- JUAL 🔴: memerlukan Close < Open
- Efek 🧽: Menyaring pembalikan lemah, mengurangi noise, mungkin masuk lebih lambat ⏳
📌 Tampilan EMA
👁️ Tampilkan EMA Cepat
- Fungsinya 🧠: Menampilkan/menyembunyikan garis EMA cepat.
- Penggunaan 💡: Sembunyikan jika ingin grafik bersih 🧼
👁️ Tampilkan EMA Lambat
- Fungsinya 🧠: Menampilkan/menyembunyikan garis EMA lambat.
- Penggunaan 💡: Tetap terlihat untuk konteks tren 🧭
🎛️ Kontrol Visual (Manajemen Kekacauan) 🧹✨
🚦 Tampilkan Sinyal
- Fungsinya 🧠: Menampilkan/menyembunyikan marker BELI/JUAL.
- Termasuk 🧷: marker BELI 🟢 / JUAL 🔴 (saja)
- Tips 💡: Nonaktifkan untuk mode “hanya garis” 📏
🏷️ Tampilkan Label TP
- Fungsinya 🧠: Menampilkan/menyembunyikan label seperti TP1, TP2…
- Efek 🧼: Mematikan menghilangkan banyak kebisingan teks pada TF lebih tinggi 📉
- Catatan 🧷: Label muncul hanya sekali per hit TP ✅
⚠️ Tampilkan Tanda Pembatalan
- Fungsinya 🧠: Menampilkan/menyembunyikan marker INV BELI / INV JUAL.
- Penggunaan 🧠: Berguna saat ingin mempelajari pembalikan sinyal 🔁
🎯🛑 Tampilkan Tanda TP/SL Akhir
- Fungsinya 🧠: Menampilkan/menyembunyikan marker TP dan SL akhir.
- Penggunaan 📒: Bagus untuk meninjau distribusi hasil 🎲
📏 Tampilkan Garis Risiko (Masuk/SL/TP)
- Fungsinya 🧠: Menggambar garis Masuk 🏁, SL 🛑, TP Akhir 🎯 di grafik.
- Efek 📌: Memvisualisasikan struktur perdagangan virtual secara instan 🧠
🟢 Tampilkan Garis TP Menengah
- Fungsinya 🧠: Menggambar garis putus-putus untuk level TP1/TP2/…
- Tips 🧼: Nonaktifkan jika grafik terlalu “spaghetti hijau” 🍝🟢
📌 Pertahankan Garis Risiko Terakhir
- Fungsinya 🧠: Menjaga garis Entry/SL/TP terakhir tetap terlihat setelah keluar virtual (TP/SL).
- Mengapa berguna 📒: Sempurna untuk pencatatan jurnal & analisis pasca-perdagangan 🧑🔬✅
🧾 Maks Marker di Grafik (0=tak terbatas)
- Fungsinya 🧠: Membatasi berapa banyak objek teks yang ditinggalkan indikator di grafik.
- Cara kerja ♻️: Saat batas terlampaui, marker tertua dihapus secara otomatis.
- Rekomendasi 🎛️: 80–200 tergantung timeframe dan kedalaman riwayat 🕰️
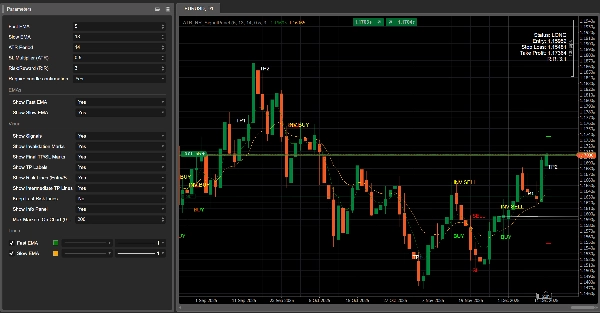
🧾 Tampilkan Panel Info
- Fungsinya 🧠: Menampilkan panel status ringkas di grafik.
- Menampilkan 📋: Status (LONG/SHORT/Tidak Ada Posisi), Masuk, SL, TP, RR yang dihitung.
Ringkasan
The indicator simulates virtual trades by setting entry price, stop loss, and take profit levels using Average True Range (ATR) for volatility-based risk sizing combined with a configurable risk-to-reward multiplier. It tracks intermediate take profit levels and monitors price action bar-by-bar to mark virtual trade outcomes without placing actual orders.
Key features include optional candle confirmation for signals, multi-instance support to run multiple configurations on the same chart, and visual clutter controls such as limiting markers and toggling display of EMAs, signals, and risk lines. An info panel provides a compact status overview of virtual positions. Parameters allow customization of EMA periods, ATR period, stop loss multiplier, and risk-reward ratio to adapt to different trading styles and market conditions.
Supported markets include Forex, indices, commodities, stocks, and cryptocurrencies, with symbols like GBPUSD, EURUSD, XAUUSD, NAS100, and BTCUSD among the tagged assets.
Ulasan pelanggan
5 | 100 % | |
4 | 0 % | |
3 | 0 % | |
2 | 0 % | |
1 | 0 % |


