
VegaXLR - Market Sessions Alerts
Indicador
3 compras
Versão 1.0, Feb 2025
Windows, Mac
4.0
Avaliações: 1
Descrição
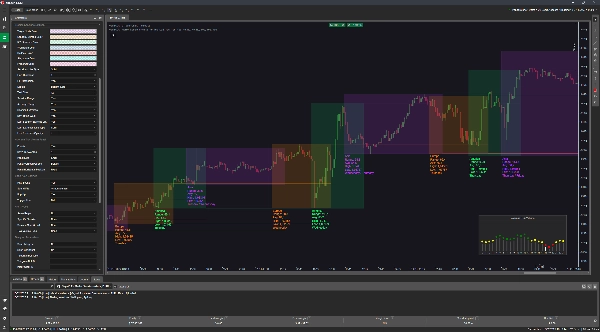
O Indicador de Alertas das Sessões de Mercado do cTrader ajuda os traders ao marcar as sessões de mercado e combiná-las em grupos regionais: Ásia, América e Europa. Ele estende as máximas e mínimas das sessões para destacar níveis-chave de suporte e resistência, e envia alertas via Telegram, Email ou pop-ups do cTrader quando os preços atingem esses níveis. Além disso, possui um painel que exibe o volume médio de ticks para cada hora, auxiliando na identificação dos melhores momentos para negociar.
Recursos:
- Destaques das Sessões de Mercado:
-
- Marca sessões individuais: Tóquio, Londres, Nova York/América, Wellington, Sydney, Singapura, Frankfurt.
- Combina sessões em grupos regionais: Ásia, Europa, América.
- Níveis de Suporte e Resistência:
-
- Estende as máximas e mínimas das sessões para identificar níveis-chave de suporte e resistência.
- Alertas Personalizáveis:
-
- Notifica via Telegram, Email, pop-ups do cTrader e som.
- Tipos de alerta incluem:
-
- Mesma Região: Alerta quando o preço da sessão atual toca os extremos da sessão anterior na mesma região.
- Sessão Específica: Alerta quando o preço toca os extremos de uma sessão passada selecionada.
- Início e Fim da Sessão: Alerta no começo e no fim das sessões.
- Tipo de Volume de Tick: Alerta quando o volume médio de ticks atinge um nível especificado.
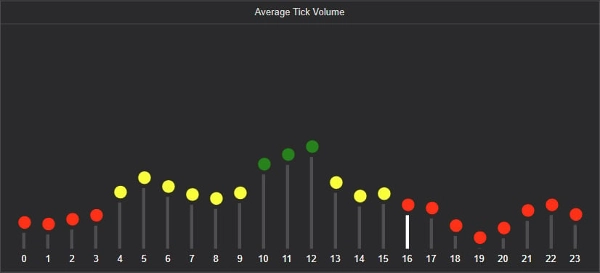
- Painel de Volume Médio de Tick:
-
- Exibe o volume médio de ticks para cada hora ao longo de um número configurável de dias.
- Usa codificação por cores para indicar níveis de volume: Vermelho (baixo), Amarelo (médio), Verde (alto).
- Guia do Usuário: Você pode acessar o guia do usuário deste indicador clicando em um pequeno botão no gráfico.
Este indicador foi projetado para aprimorar estratégias de negociação fornecendo sinais visuais claros e alertas oportunos baseados na dinâmica das sessões de mercado.
Resumo
Perfil do indicador
Avaliações de clientes
4.0
Avaliações: 1
5 | 0 % | |
4 | 100 % | |
3 | 0 % | |
2 | 0 % | |
1 | 0 % |
Avaliações de clientes
Conversa
Perguntas frequentes
Forex
Os produtos disponíveis através da cTrader Store, incluindo bots de negociação, indicadores e plugins, são fornecidos por programadores terceiros e são disponibilizados apenas para fins informativos e de acesso técnico. A cTrader Store não é um corretor e não fornece aconselhamento em matéria de investimento, recomendações pessoais ou qualquer garantia de desempenho no futuro.


Preço
229
Vendas
686
Instalações gratuitas