
Descrição
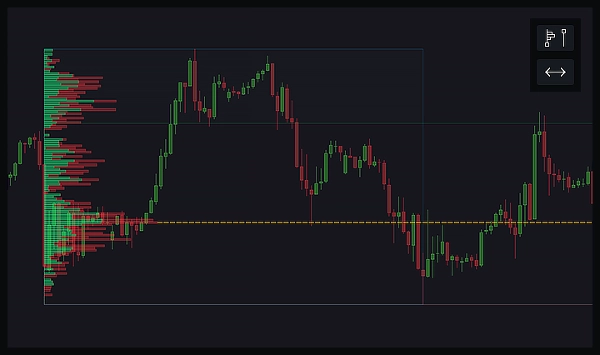
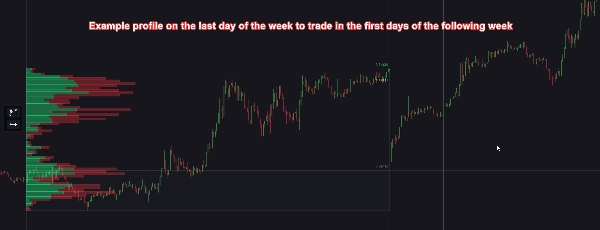
Um Perfil de Volume de Intervalo Fixo é uma ferramenta que mostra quanta atividade de negociação ocorreu em diferentes níveis de preço dentro de um intervalo específico em um gráfico. Você desenha um retângulo sobre a área de seu interesse, e o perfil exibe barras horizontais indicando o volume de negociações em cada nível de preço dentro desse intervalo. Isso ajuda a ver onde ocorreram as maiores compras e vendas, destacando níveis de preço chave que podem ser importantes para tomar decisões de negociação.
Componentes principais do Perfil de Volume de Intervalo Fixo incluem:
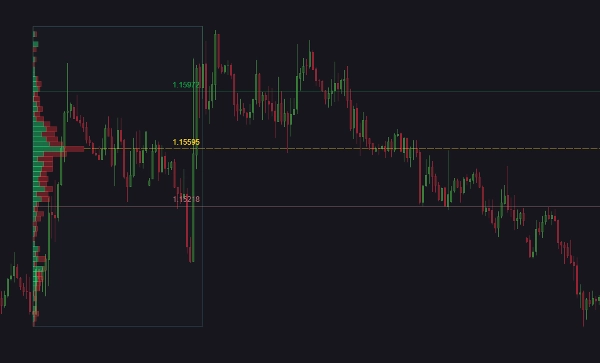
- Ponto de Controle (POC): O nível de preço com o maior volume de negociação dentro do intervalo selecionado. Isso é frequentemente visto como um nível significativo de suporte ou resistência porque reflete um preço onde muita atividade de negociação ocorreu.
- Limite Superior da Área de Valor (VAH): O limite superior do intervalo de preço onde ocorreu 70% do volume total de negociação. Preços acima desse nível são considerados menos negociados e potencialmente sobrevalorizados.
- Limite Inferior da Área de Valor (VAL): O limite inferior do intervalo de preço onde ocorreu 70% do volume total de negociação. Preços abaixo desse nível são considerados menos negociados e potencialmente subvalorizados.
Essas linhas ajudam os traders a identificar níveis significativos de preço que podem atuar como suporte ou resistência. Ao entender onde a maior parte do volume de negociação está concentrada, os traders podem tomar decisões mais informadas sobre potenciais movimentos de preço, pontos de entrada e saída.
Por exemplo, se o preço atual estiver próximo ao POC, isso pode indicar um forte nível de suporte ou resistência. Se o preço estiver dentro da área de valor, sugere que está em uma faixa de valor justo, enquanto preços fora da área de valor podem ser vistos como pontos potenciais de rompimento ou queda.
O que este Indicador Faz:
Este indicador aprimora seu gráfico de negociação com uma análise poderosa do perfil de volume e alertas personalizáveis. Com dois botões intuitivos, você pode facilmente desenhar perfis de volume de intervalo fixo e expandir ou contrair níveis chave até o infinito. O perfil de volume pode ser visualizado em dois modos diferentes, barras totais ou barras de alta e baixa. Ajuste o número de níveis, a resolução dos dados (Precisa ou Rápida) e o tamanho da área de valor para atender às suas necessidades.
Os intervalos magnéticos atualizam automaticamente com base na última vela, garantindo que sua análise esteja sempre atualizada. Você também pode personalizar a aparência e o comportamento do perfil e seus componentes, incluindo as linhas POC, VAH e VAL. Alertas podem ser configurados para toques de preço, com opções para acionar ações como iniciar ou parar cBots e fechar posições. Os alertas podem ser entregues via som, pop-ups do cTrader, mensagens do Telegram (com capturas de tela opcionais) e e-mails.
Recursos:
- Perfil de Volume de Intervalo Fixo: Desenhe um retângulo para visualizar o perfil de volume de um intervalo selecionado.
- Expandir/Contrair Linhas: Estenda ou contraia as linhas POC, VAH e VAL até o infinito.
- Modos do Perfil de Volume: Escolha entre volume total ou barras de alta e baixa.
- Níveis e Resolução Personalizáveis: Selecione o número de níveis e a resolução (Precisa ou Rápida).
- Área de Valor Ajustável: Defina o tamanho da área de valor.
- Intervalos Magnéticos: Redimensiona automaticamente os intervalos para alinhar com a última vela, atualizado a cada 1–10 minutos ou no fechamento da barra.
- Aparência Personalizável: Altere a posição, tamanho e estilo dos botões, linhas e barras de volume.
- Alertas para Toques de Preço: Receba notificações quando o preço tocar as linhas POC, VAH ou VAL.
- Integração com cBot: Inicie ou pare cBots com base nos alertas.
- Gerenciamento de Posições: Feche posições quando ocorrerem alertas, com opções personalizáveis para cada linha (POC, VAH e VAL).
- Métodos de Alerta: Receba alertas via som, pop-ups do cTrader, mensagens do Telegram (com capturas de tela opcionais) e e-mails.
- Otimização de Desempenho: Opção para excluir automaticamente intervalos passados que não estão visíveis no gráfico para melhorar o desempenho.
- Controle Global de Alertas: Ative ou desative facilmente todos os alertas deste indicador.
- Guia do Usuário: Você pode abrir facilmente o guia do usuário deste indicador através de um pequeno botão no gráfico.
Resumo
The indicator offers two visualization modes: total volume or separate up and down volume bars. It features customizable settings for the number of volume levels, data resolution (Precise or Fast), and value area size. Magnetic ranges automatically update based on the latest candle to keep analysis current. Users can expand or contract POC, VAH, and VAL lines infinitely.
Alerts can be configured for price touches on these key levels, with notifications via sound, platform pop-ups, Telegram (including optional screenshots), and email. Alerts can trigger actions such as starting/stopping cBots or closing positions. The indicator also supports customizable appearance, performance optimization by auto-deleting out-of-view ranges, and global alert control. A user guide is accessible directly from the chart interface.
Avaliações de clientes
5 | 67 % | |
4 | 0 % | |
3 | 33 % | |
2 | 0 % | |
1 | 0 % |


![Logótipo de "[Stellar Strategies] Smart ADX"](https://cdn.ctrader.com/image/webp/af13b084-b6f6-41db-b7bc-c7e688b57b05_36929)


