
Opis
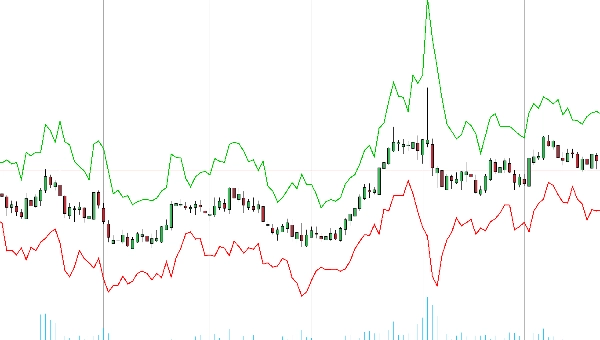
ATR Bands dynamicznie wyświetla górne i dolne pasma na Twoich wykresach cenowych.
Te pasma oferują wgląd w czasie rzeczywistym w zmienność rynku, pomagając precyzyjnie identyfikować potencjalne punkty wybicia i odwrócenia. Idealne dla traderów na każdym poziomie, ATR Bands usprawniają proces podejmowania decyzji, dostarczając wyraźne wskazówki wizualne do ustawiania stop-lossów, take-profitów oraz optymalizacji punktów wejścia.
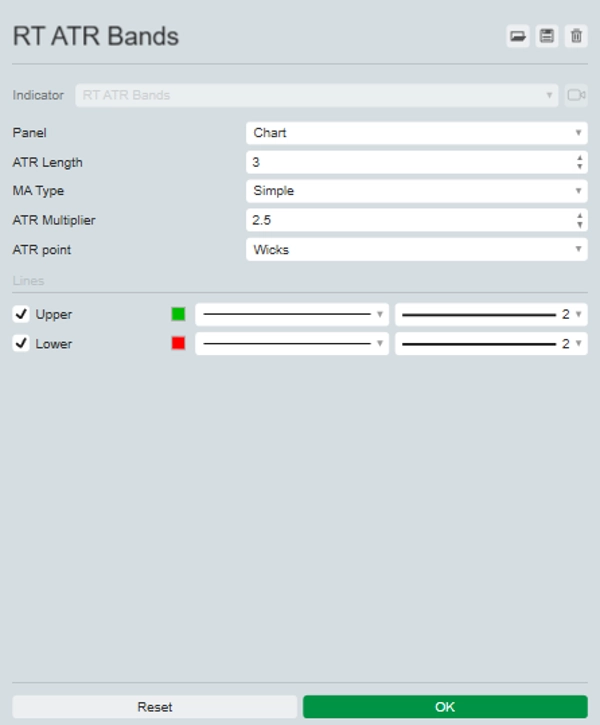
Ustawienia pozwalają wybrać preferowany okres i mnożnik, zmienić średnią kroczącą używaną do obliczania ATR oraz korzystać z knotów świec lub zamknięcia świecy.
Ulepsz swój zestaw narzędzi handlowych już dziś i doświadcz różnicy z ATR Bands – Twoją przewagą na rynku.
Podsumowanie
Podsumowanie AI
RT ATR Bands is a technical indicator that dynamically plots upper and lower bands on price charts based on the Average True Range (ATR). These bands provide real-time visualization of market volatility, assisting traders in identifying potential breakout and reversal points with greater precision. The indicator supports customization of key parameters, including the ATR calculation period, multiplier, choice of moving average, and whether to use candle wicks or candle closes for calculations. It is applicable across various markets such as Forex, cryptocurrencies (e.g., BTCUSD), commodities, indices, and stocks. By offering clear visual cues, RT ATR Bands aids in setting stop-loss and take-profit levels and optimizing trade entries, making it suitable for traders of all experience levels.
Profil wskaźnika
Opinie klientów
0.0
Opinie: 0
Opinie klientów
Ten produkt nie ma jeszcze opinii. Wypróbowałeś(-aś) go już? Bądź pierwszy(-a) i powiedz o tym innym!
Dyskusja
Częste pytania
BTCUSD
Forex
Breakout
Indices
EURUSD
Commodities
GBPUSD
NZDUSD
Prop
Crypto
Stocks
XAUUSD
NAS100
ATR
USDJPY
Produkty dostępne za pośrednictwem cTrader Store, w tym boty handlowe, wskaźniki i wtyczki, dostarczane są przez deweloperów zewnętrznych i udostępniane wyłącznie w celach informacyjnych oraz w celu zapewnienia dostępu technicznego. cTrader Store nie jest brokerem i nie zapewnia doradztwa inwestycyjnego, nie udziela spersonalizowanych rekomendacji ani nie gwarantuje przyszłych wyników.


Cena
Od 25/09/2024
20
Sprzedaż