
Opis
Przedstawiamy konfigurowalny klasyczny MACD wskaźnik, zaprojektowany, aby wzbogacić Twoje doświadczenia handlowe o spersonalizowane funkcje.
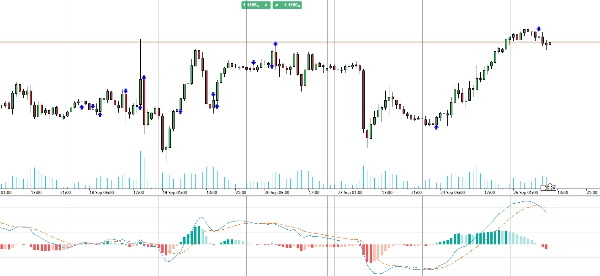
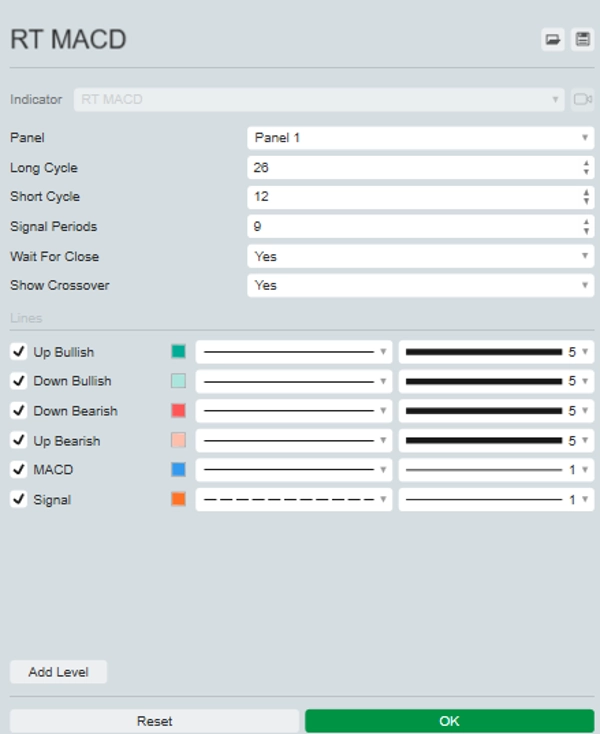
Ta ulepszona wersja tradycyjnego MACD pozwala na dostosowanie kolorów linii i histogramu dla lepszej wizualizacji wykresu. Opcjonalnie może aktualizować się w czasie rzeczywistym, korzystając z danych tick zamiast zamknięcia świecy, dostarczając terminowe informacje na szybko zmieniających się rynkach.
Dodatkowo podkreśla punkty przecięcia bezpośrednio na wykresie, ułatwiając wykrywanie potencjalnych sygnałów kupna i sprzedaży.
Ulepsz swoją strategię handlową za pomocą konfigurowalnego klasycznego MACD wskaźnika dla lepszej dokładności i podejmowania decyzji.
Podsumowanie
Profil wskaźnika
Opinie klientów
0.0
Opinie: 0
Opinie klientów
Ten produkt nie ma jeszcze opinii. Wypróbowałeś(-aś) go już? Bądź pierwszy(-a) i powiedz o tym innym!
Dyskusja
Częste pytania
BTCUSD
Forex
Signal
Indices
EURUSD
Commodities
GBPUSD
NZDUSD
Prop
Scalping
Crypto
Stocks
XAUUSD
NAS100
MACD
USDJPY
Produkty dostępne za pośrednictwem cTrader Store, w tym boty handlowe, wskaźniki i wtyczki, dostarczane są przez deweloperów zewnętrznych i udostępniane wyłącznie w celach informacyjnych oraz w celu zapewnienia dostępu technicznego. cTrader Store nie jest brokerem i nie zapewnia doradztwa inwestycyjnego, nie udziela spersonalizowanych rekomendacji ani nie gwarantuje przyszłych wyników.


Cena
Od 25/09/2024
20
Sprzedaż