
Average Cost Price
مؤشر
1 عمليات الشراء
الإصدار 1.0، Sep 2025
Windows, Mac
4.5
التقييمات: 2
الوصف
تحديد متوسط سعر التكلفة لعدة صفقات أمر صعب. تعيين وقف الخسارة وجني الأرباح صعب لأن متوسط سعر عدة صفقات غير معروف.
يوفر لك مؤشر متوسط سعر التكلفة:
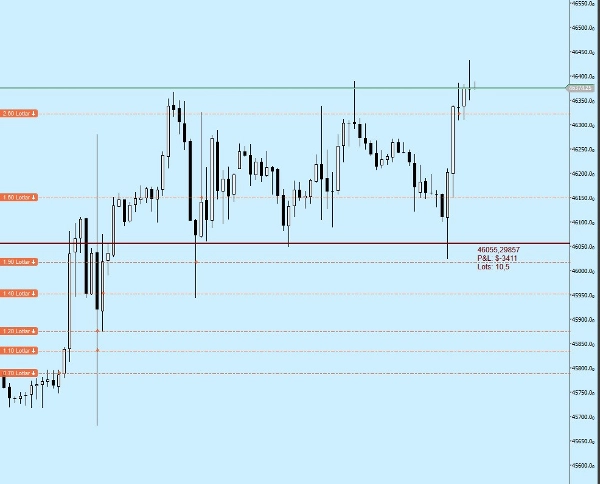
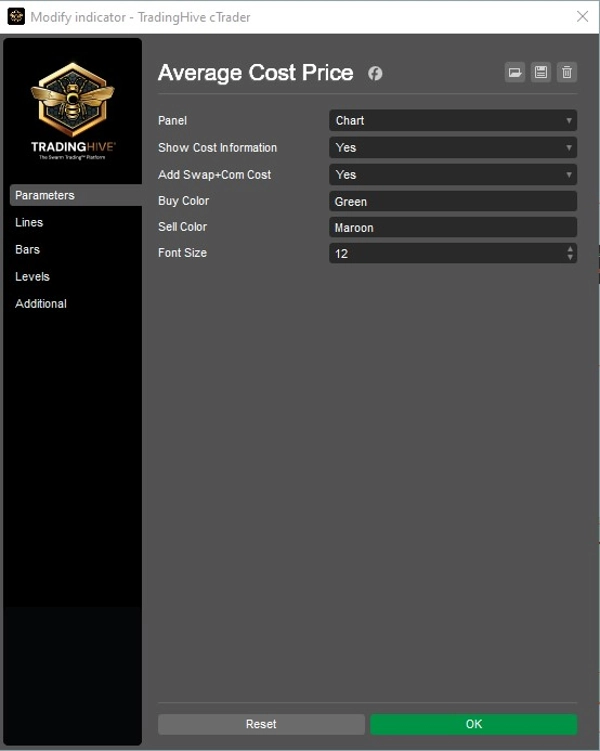
* خط متوسط سعر الشراء أو البيع،
* إجمالي الربح أو الخسارة بناءً على خط متوسط التكلفة،
* إجمالي كمية اللوت
الملخص
ملخص الذكاء الاصطناعي
Average Cost Price is a trading indicator designed to help traders monitor their open positions directly on the chart. It calculates and displays the average buy or sell price line for multiple trades, simplifying the process of managing positions with varying entry prices. The indicator also shows the total profit or loss amount based on this average cost line, providing a clear overview of overall position performance. Additionally, it tracks the total lot quantity held. This tool supports various markets including Forex, Stocks, Commodities, Crypto, and Indices, and is applicable to symbols such as BTCUSD, EURUSD, GBPUSD, XAUUSD, and USDJPY. By consolidating multiple trade entries into a single average cost metric, it aids in setting more accurate Stop Loss and Take Profit levels.
ملف تعريف المؤشر
تقييمات العملاء
4.5
التقييمات: 2
5 | 50 % | |
4 | 50 % | |
3 | 0 % | |
2 | 0 % | |
1 | 0 % |
تقييمات العملاء
October 3, 2025
ngl, trade control feels cleaner and that is enough to keep testing it. Win rate means less without average R.
October 1, 2025
The tool feels better once the workflow feels calmer, and spread and slippage need a line in the notes.
مناقشة
الأسئلة الشائعة
BTCUSD
Prop
Forex
Indices
EURUSD
Commodities
GBPUSD
Crypto
Stocks
XAUUSD
USDJPY
يتم توفير المنتجات المتاحة من خلال cTrader Store، بما في ذلك روبوتات التداول والمؤشرات والإضافات، من قبل مطوري الطرف الثالث وإتاحتها لأغراض الوصول المعلوماتي والفني فقط. cTrader Store ليس وسيطًا ولا يقدم نصائح استثمارية أو توصيات شخصية أو أي ضمان للأداء المستقبلي.


السعر
منذ 01/09/2025
1
المبيعات