
LT_Ind_VWAP
Indicador
2 compras
Versão 1.0, Oct 2025
Windows, Mac
4.5
Avaliações: 2
Descrição
Nota: Testado apenas no cTrader para Windows.
LT_Ind_VWAP é um indicador VWAP ancorado prático para cTrader.
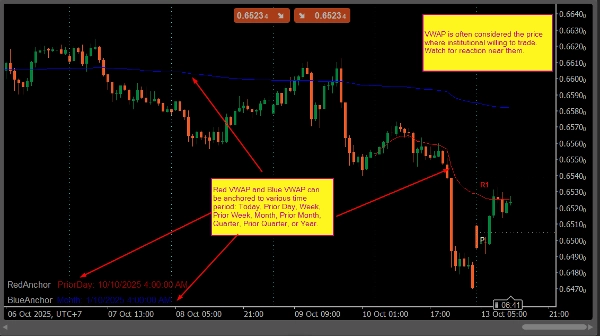
Ele plota duas linhas VWAP (Vermelha e Azul) que podem ser ancoradas a um período selecionado, como Hoje, Dia Anterior, Semana, Semana Anterior, Mês, Mês Anterior, Trimestre, Trimestre Anterior ou Ano.
O indicador recalcula automaticamente quando um novo dia começa e mostra a âncora ativa e a data diretamente no gráfico. Foi projetado para traders que usam níveis VWAP para acompanhar o valor justo, viés de tendência ou áreas de reversão à média.
Principais Recursos
- Duas linhas VWAP com âncoras independentes
- Âncoras suportadas: Hoje, Dia Anterior, Semana, Semana Anterior, Mês, Mês Anterior, Trimestre, Trimestre Anterior, Ano
- Recalculo automático na mudança de sessão
- Informações da âncora exibidas no gráfico
- Configuração simples, uso mínimo de recursos
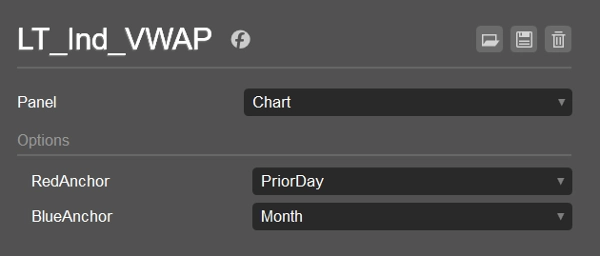
Configurações Padrão
- VWAP Vermelho: Dia Anterior
- VWAP Azul: Mês
Casos de Uso
- Comparar preço intradiário com VWAP do dia anterior
- Monitorar VWAP mensal ou trimestral para viés de swing
- Encontrar confluência entre níveis VWAP de curto e longo prazo
Resumo
Resumo de IA
LT_Ind_VWAP is an anchored VWAP (Volume Weighted Average Price) indicator designed for the cTrader platform (Windows version). It displays two independent VWAP lines—red and blue—each anchored to selectable time periods including Today, Prior Day, Week, Prior Week, Month, Prior Month, Quarter, Prior Quarter, or Year. The indicator automatically recalculates at the start of a new trading session and shows the active anchor and date on the chart for easy reference. Its primary use cases include comparing intraday prices with prior-day VWAP, monitoring monthly or quarterly VWAP for swing trading bias, and identifying confluence between short- and long-term VWAP levels. The default settings anchor the red VWAP to the prior day and the blue VWAP to the current month. LT_Ind_VWAP offers a simple setup with minimal resource consumption, making it suitable for traders who rely on VWAP levels to assess fair value, trend direction, or mean-reversion zones across various markets such as Forex, indices, commodities, cryptocurrencies, and stocks.
Perfil do indicador
Avaliações de clientes
4.5
Avaliações: 2
5 | 50 % | |
4 | 50 % | |
3 | 0 % | |
2 | 0 % | |
1 | 0 % |
Avaliações de clientes
October 26, 2025
Conversa
Perguntas frequentes
Prop
Forex
Indices
Commodities
Crypto
Stocks
VWAP
Os produtos disponíveis através da cTrader Store, incluindo bots de negociação, indicadores e plugins, são fornecidos por programadores terceiros e são disponibilizados apenas para fins informativos e de acesso técnico. A cTrader Store não é um corretor e não fornece aconselhamento em matéria de investimento, recomendações pessoais ou qualquer garantia de desempenho no futuro.


Preço
Desde 25/09/2024
34
Vendas