Описание
Откройте для себя зоны торговли с высокой вероятностью с помощью Advanced Supply Demand!
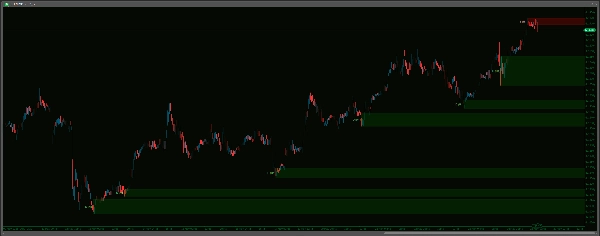
Получите более ясное представление о рынке с помощью индикатора Advanced Supply Demand Zones V2 . Этот мощный инструмент автоматически определяет и выделяет ключевые зоны предложения и спроса на вашем графике, потенциально указывая места значительных ценовых реакций. Благодаря сложному алгоритму обнаружения точек разворота, возможностям мультивременных рамок (MTF) и широким настройкам, вы можете идеально адаптировать индикатор под свой стиль торговли. Эффективно управляйте зонами с помощью опций удаления сломанных или совпадающих зон, применения временных ограничений и поддержания чистоты графика. Улучшите свой анализ с помощью настраиваемого внешнего вида зон, четких меток временных рамок и надежной системы звуковых оповещений – с буфером живых данных для предотвращения исторических шумов – гарантируя, что вы будете уведомлены о ключевых приближениях цены к вашим определенным зонам. Поднимите свой технический анализ на новый уровень и принимайте более обоснованные торговые решения!
-------------------
Улучшения по сравнению с V1:
Advanced Supply Demand V2 предлагает значительные улучшения для более точного, удобного и эффективного торгового опыта:
- Более умные и тихие оповещения – никаких исторических шумов!
-
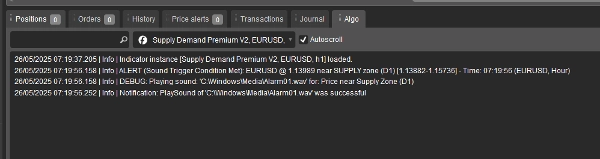
- Оповещения срабатывают на реальном времени после загрузки, исключая раздражающие исторические сигналы! Кроме того, выбирайте звуки из удобного выпадающего меню, что значительно удобнее, чем вводить имена файлов вручную. Также доступна опция Максимальное количество оповещений на зону для предотвращения спама уведомлений.
- Простая настройка – упрощенные параметры!
-
- Наслаждайтесь гораздо более интуитивной настройкой с выпадающими меню для большинства опций (временные рамки, выбор Да/Нет, стили линий, звуковые файлы). Настраивайте правильно с первого раза, каждый раз!
- Более четкая логика и управление зонами – меньше беспорядка, больше ясности!
-
- Оптимизировано для более прямого и действенного подхода. V2 использует четкие правила для удаления сломанных зон, умно обрабатывает перекрывающиеся (совпадающие) зоны для поддержания чистоты графика, а также предлагает простое временное истечение для старых зон и опцию ограничения количества отображаемых зон.
- Лучший визуальный контроль – ваш график, по вашему желанию!
-
- Получите тонкую настройку с отдельными параметрами внешнего вида (цвет, толщина, стиль) для зон предложения и спроса. Точно подгоняйте визуализацию под свои предпочтения и делайте зоны интерактивными на вашем графике!
- Более гибкое определение зон!
-
- Теперь включает опцию
IncludeBarBody, позволяющую выбирать между зонами только по фитилю или зонами, включающими тело свечи, что дает потенциально более широкий и иной взгляд на рынок.
- Теперь включает опцию
-------------------
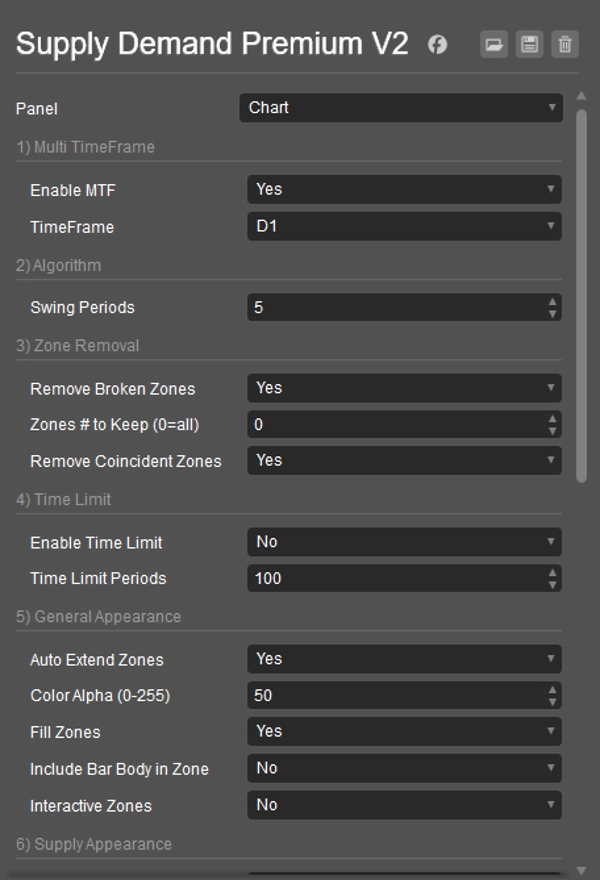
Руководство по настройкам: Advanced Supply Demand Zones
1) Мультивременные рамки
- Включить MTF: Да, чтобы видеть зоны с другой временной рамки на текущем графике. Нет – для зон текущего графика.
- Временная рамка: Если MTF включен, выберите здесь другую временную рамку (например, зоны H4 на графике M15).
2) Алгоритм
- Периоды свинга: Определяет, сколько баров характеризуют сильный поворот рынка (точку свинга) для создания зон. Чем выше число, тем сильнее (и обычно меньше) зон.
3) Удаление зон
- Удалять сломанные зоны: Да, чтобы автоматически удалять зоны после явного пробоя цены.
- Количество зон для отображения (0=все): Ограничивает количество отображаемых последних зон.
0показывает все. - Удалять совпадающие зоны: Да, чтобы автоматически удалять более старую из двух сильно перекрывающихся зон, сохраняя график чище.
4) Временное ограничение
- Включить временное ограничение: Да, чтобы очень старые зоны исчезали автоматически.
- Периоды временного ограничения: Если включено, зоны старше этого количества баров будут удалены.
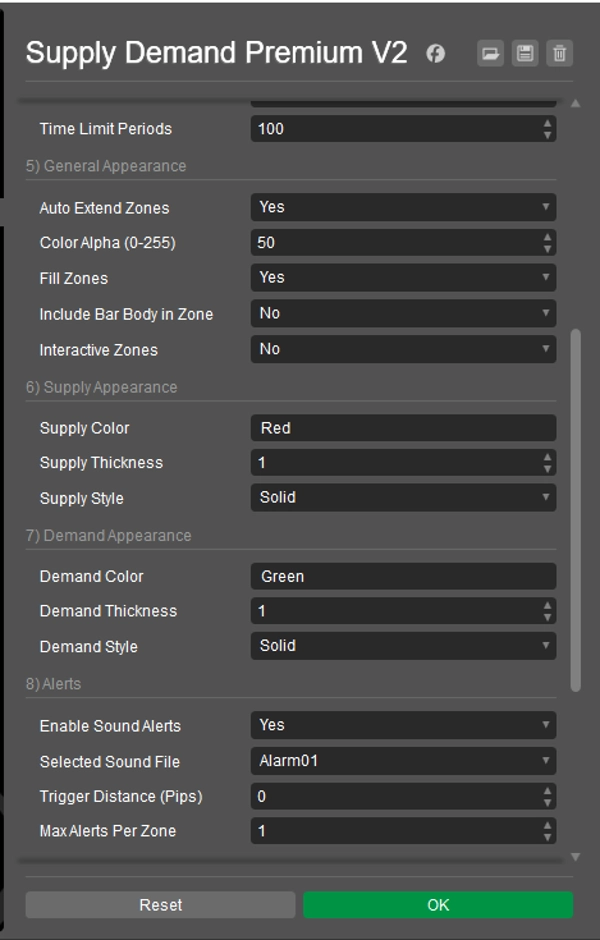
5) Общий внешний вид
- Автоматическое расширение зон: Да, чтобы рисовать зоны далеко в будущее. Нет – для более коротких зон.
- Прозрачность цвета (0-255): Устанавливает степень прозрачности цветов зон (0 = невидимый, 255 = сплошной).
- Заполнение зон: Да, чтобы заполнить зоны цветом. Нет – только контуры.
- Включать тело свечи в зону: Да, чтобы использовать тело свечи (плюс фитили) для ширины зоны. Нет – использовать только фитили.
- Интерактивные зоны: Да, чтобы разрешить кликать и перемещать зоны на графике.
6) Внешний вид предложения
- Цвет предложения: Устанавливает цвет для зон предложения (верхних). (например, "Красный", "#FF0000")
- Толщина предложения: Устанавливает толщину линии границы для зон предложения.
- Стиль предложения: Устанавливает стиль линии границы (сплошная, точки и т.д.) для зон предложения.
7) Внешний вид спроса
- Цвет спроса: Устанавливает цвет для зон спроса (нижних). (например, "Зеленый", "#00FF00")
- Толщина спроса: Устанавливает толщину линии границы для зон спроса.
- Стиль спроса: Устанавливает стиль линии границы (сплошная, точки и т.д.) для зон спроса.
8) Оповещения Примечание: Чтобы избежать оповещений по старым данным или сразу при запуске, звуковые оповещения активируются только после 20 живых ценовых тиков с момента загрузки индикатора на ваш график.
- Включить звуковые оповещения: Да, чтобы включить звуковые уведомления при приближении цены к зоне.
- Выбранный звуковой файл: Выберите звук для оповещений. Системные звуки (например, "Alarm01") пытаются воспроизводиться из
C:\Windows\Media\; убедитесь, что файл существует и cTrader имеет к нему доступ. "cTraderDefaultAlert" использует стандартный звук cTrader. "None" – без звука. - Расстояние срабатывания (в пунктах): Насколько близко (в пунктах) цена должна подойти к краю зоны, чтобы сработало оповещение.
- Максимум оповещений на зону: Ограничивает, сколько раз будет звучать оповещение для одной и той же зоны.
9) Метка временной рамки
- Показывать метку временной рамки: Да, чтобы отображать временную рамку (например, H1, D1) на каждой зоне.
- Цвет метки предложения: Цвет текста меток зон предложения.
- Цвет метки спроса: Цвет текста меток зон спроса.
- Смещение метки по X (бары): Регулирует горизонтальное положение метки от начала зоны.
- Размер шрифта метки: Устанавливает размер текста метки.
10) Прочее
- Очистка при запуске: Да, чтобы удалять старые рисунки этого индикатора при запуске cTrader или добавлении индикатора на график.
- Повторное определение удалённых зон: (Этот параметр имеет ограниченное прямое влияние в текущей версии. Зоны переоцениваются на каждом тике; если критерии для зоны снова выполняются и она не считается сломанной, она появится независимо от значения этого параметра Да или Нет).
----------------------------
Пожалуйста, ознакомьтесь с моими другими индикаторами:
https://ctrader.com/products/1181
https://ctrader.com/products/1182
https://ctrader.com/products/1180
https://ctrader.com/products/1015
https://ctrader.com/products/555
https://ctrader.com/products/553
https://ctrader.com/products/554
https://ctrader.com/products/552
https://ctrader.com/products/557
https://ctrader.com/products/845
https://ctrader.com/products/848
https://ctrader.com/products/847
https://ctrader.com/products/846
https://ctrader.com/products/551
https://ctrader.com/products/574
https://ctrader.com/products/573
https://ctrader.com/products/556
https://ctrader.com/products/558
https://ctrader.com/products/559
https://ctrader.com/products/560
Сводка
Visual customization is granular, with separate settings for supply and demand zone colors, thickness, and line styles. Zones can be configured to include candle wicks only or both wicks and bodies, providing flexible market perspectives. Interactive zones allow users to click and move zones directly on the chart.
The alert system is designed to minimize noise by triggering notifications only on live price action after the indicator loads, with configurable sound options and limits on alert frequency per zone. Timeframe labels can be displayed on zones with customizable appearance settings.
Additional features include automatic cleanup of old drawings on startup and options to re-identify zones dynamically. This indicator aims to enhance technical analysis by clearly marking high-probability trading zones for more informed decision-making.
Отзывы покупателей
5 | 0 % | |
4 | 100 % | |
3 | 0 % | |
2 | 0 % | |
1 | 0 % |


![Логотип продукта "[Hamster-Coder] Pivot Points MTF"](https://cdn.ctrader.com/image/webp/4c143e5a-309c-40e3-a578-f04d1e133ffa_31159)