
Описание
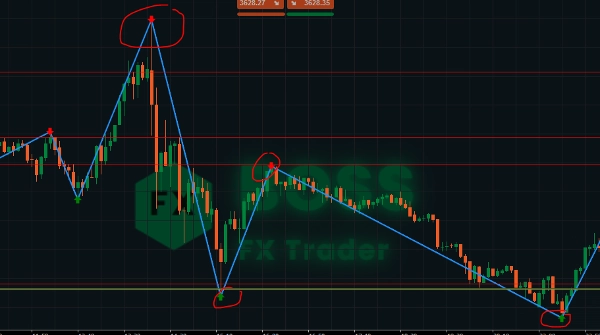
Индикатор ZigZag — это инструмент анализа структуры рынка, который фильтрует мелкие колебания цены и выделяет основные максимумы и минимумы. Соединяя эти точки линиями, трейдеры могут легко определить тренды, развороты и графические модели.
Он сам по себе не генерирует сигналы на покупку/продажу, но в сочетании с анализом ценового действия, уровнями поддержки/сопротивления или другими индикаторами становится мощным инструментом для скальпинга, внутридневной и свинг-торговли.
🔎 Ключевые особенности
- Упрощает рыночный шум, показывая четкие ценовые колебания.
- Помогает определить уровни поддержки и сопротивления.
- Полезен для выявления графических моделей (голова и плечи, двойные вершины/дна, треугольники).
- Содействует подтверждению тренда и входам на откатах.
- Индикатор стрелок Sell и Buy
⚡ Скальпинг с ZigZag
- Таймфреймы: 1м – 5м
- Цель: ловить небольшие, но частые движения.
- Как использовать:
-
- Дождитесь формирования нового максимума/минимума.
- Отметьте их как микроуровни поддержки или сопротивления.
- Входите в сделки на пробоях или откатах к этим уровням ZigZag.
- Держите стоп-лосс чуть за последним максимумом/минимумом (узкий риск).
- Цельтесь в быстрый тейк-профит (5–15 пунктов в зависимости от волатильности).
👉 Лучше всего работает в сессиях с высокой волатильностью (открытие Лондона / Нью-Йорка).
⏱️ Внутридневная торговля с ZigZag
- Таймфреймы: 15м – 1ч
- Цель: торговать дневные тренды и ключевые внутридневные развороты.
- Как использовать:
-
- Определите основной внутридневной тренд, используя более крупные колебания ZigZag.
- Используйте точки ZigZag как зоны поворота для входа (покупайте на откатах в восходящем тренде, продавайте на откатах в нисходящем).
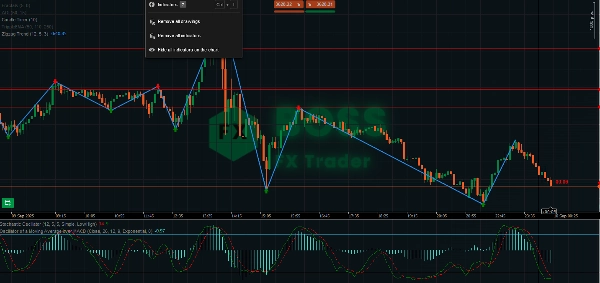
- Комбинируйте с осцилляторами (RSI/Stochastic) для подтверждения перекупленности/перепроданности возле экстремумов ZigZag.
- Используйте предыдущие максимумы/минимумы как логичные уровни стоп-лосса и тейк-профита.
👉 Отлично подходит для дейтрейдеров, которые хотят получать движения в 20–50 пунктов.
📆 Свинг-трейдинг с ZigZag
- Таймфреймы: 4ч – дневной
- Цель: ловить крупные трендовые движения и позиционные сделки.
- Как использовать:
-
- Используйте ZigZag для определения основной структуры рынка (высшие максимумы и минимумы = восходящий тренд).
- Входите после откатов, когда формируется новый минимум в восходящем тренде.
- Размещайте стоп-лосс ниже последнего крупного минимума.
- Цельтесь в 2–3-кратный риск или следующий уровень колебания ZigZag.
- Используйте ZigZag для выявления моделей разворота (двойная вершина/дно, голова и плечи) для выхода из сделок.
👉 Идеально подходит для удержания сделок от нескольких дней до недель.
📌 Профессиональные советы
- Настройте глубину: меньше = выше чувствительность (хорошо для скальпинга). Больше = фильтрует шум (лучше для свинга).
- Комбинируйте с объемом, фильтрами тренда или скользящими средними для подтверждения.
- Всегда проверяйте ZigZag на более высоком таймфрейме перед входом — мелкие колебания внутри большого тренда могут быть ловушками.
- Используйте ZigZag для подтверждения графических моделей (треугольники, клинья).
Оставайтесь прибыльными трейдерами!
Сводка
Key features include simplification of market noise, identification of support and resistance levels, trend confirmation, and assistance with pullback entries. It supports multiple trading styles across various timeframes: scalping (1–5 minutes), intraday trading (15 minutes to 1 hour), and swing trading (4 hours to daily). Users can adjust the indicator’s sensitivity to suit different trading approaches and combine it with volume or moving averages for confirmation. The tool is applicable to diverse markets including Forex, indices, commodities, stocks, and cryptocurrencies, supporting symbols like EURUSD, GBPUSD, XAUUSD, NAS100, and BTCUSD.
Отзывы покупателей
5 | 67 % | |
4 | 33 % | |
3 | 0 % | |
2 | 0 % | |
1 | 0 % |


