

Калькулятор спреда — это инструмент, используемый для расчёта разницы между двумя ценами или значениями, часто применяемый в финансовых контекстах при торговле. Он помогает определить потенциальную прибыль, убытки и точки безубыточности, а также оценить справедливые коэффициенты и линии в торговых сценариях.
Зачем использовать этот индикатор?
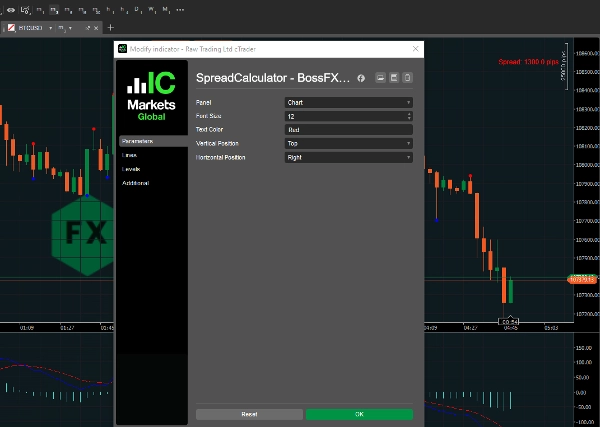
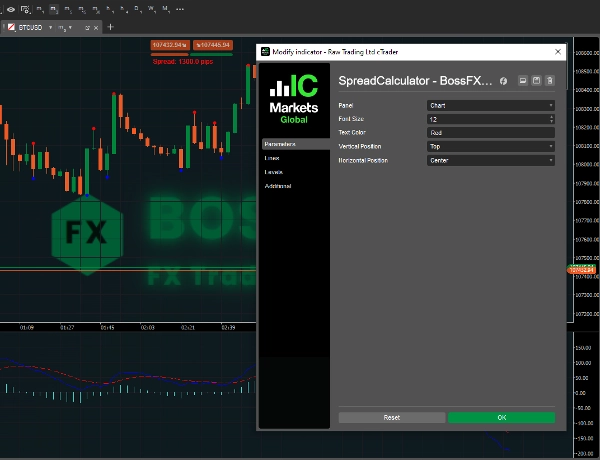
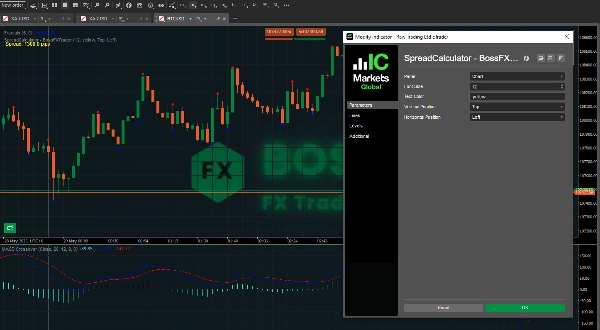
- Торгуйте с точностью: Точно знайте текущий спред каждой валютной пары или акции.
- Управляемые режимы позиционирования: Размер шрифта, цвет текста, вертикальное и горизонтальное положение.
Вот почему использование калькулятора спреда полезно:
- Понимание торговых издержек:
Спред — это основная стоимость торговли, и калькулятор помогает визуализировать эту стоимость при входе или выходе из сделки.
- Оптимизация стратегий:
Анализируя исторические спреды, вы можете оптимизировать свои торговые стратегии и снизить общие торговые издержки.
- Принятие обоснованных решений:
Калькулятор предоставляет данные о спреде, позволяя принимать обоснованные и подготовленные торговые решения.
- Расчёт требований к марже:
В спред-беттинге калькулятор спреда помогает определить необходимую маржу для вашей сделки — сумму капитала, которую нужно иметь на счёте.
- Оценка потенциальной прибыли/убытка:
Калькулятор также может оценить вашу потенциальную прибыль или убыток на основе текущего спреда и размера сделки.
- Сравнение брокеров:
Вы можете использовать калькулятор спреда для сравнения спредов, предлагаемых разными брокерами, и выбрать того, кто предоставляет лучшие условия для ваших торговых нужд.
- Анализ опционных стратегий:
В торговле опционами калькуляторы спреда помогают анализировать различные вертикальные спред-стратегии (например, бычьи/медвежьи спреды).
- Понимание цен бид-аск:
Спред — это разница между ценой бид (за которую продавец готов продать) и ценой аск (за которую покупатель готов купить).
5 | 50 % | |
4 | 50 % | |
3 | 0 % | |
2 | 0 % | |
1 | 0 % |


