
HTFBB
Indicateur
1 achats
Version 1.0, Jul 2025
Windows, Mac
5.0
Avis : 1
Description
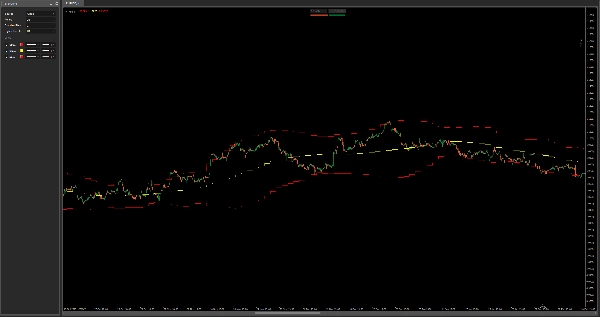
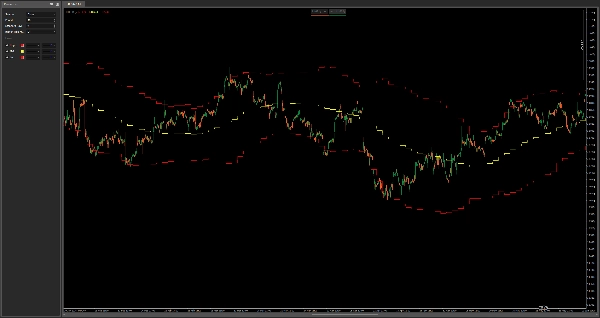
Bandes de Bollinger HTF – Carte de volatilité multi-échelles
Cet indicateur trace les Bandes de Bollinger d'une échelle de temps supérieure sur votre graphique actuel, vous offrant un contexte puissant pour la volatilité, la réversion vers la moyenne et le support/résistance dynamique — le tout sans changer d’échelle de temps.
Fonctionnalités :
- Affiche les bandes de Bollinger supérieure, médiane et inférieure de n’importe quelle échelle de temps supérieure sélectionnable
- Idéal pour repérer les zones de consolidation HTF, la pression de cassure, et les replis de tendance
- Idéal pour le scalping et les entrées intrajournalières avec une conscience des échelles de temps supérieures
- Fonctionne sur tous les actifs et toutes les échelles de temps
Combinez avec votre stratégie actuelle pour éviter de trader dans des pièges de volatilité et rester aligné avec la structure macro des prix.
Résumé
Profil de l'indicateur
Avis clients
5.0
Avis : 1
5 | 100 % | |
4 | 0 % | |
3 | 0 % | |
2 | 0 % | |
1 | 0 % |
Avis clients
July 29, 2025
confusing signals get easier to ignore, but a clean signal can still fail.
Discussion
Questions fréquentes
Les produits disponibles sur cTrader Store, notamment les bots de trading, les indicateurs et les plug-ins, sont fournis par des développeurs tiers et mis à disposition à titre informatif et à des fins d'accès technique uniquement. cTrader Store n'est pas un courtier et ne fournit aucun conseil en investissement, aucune recommandation personnelle ni aucune garantie quant aux performances futures.


Prix
Depuis le 03/01/2025
638.03K
Volume tradé
21.34K
Pips gagnés
15
Ventes