present
Inscrivez-vous et bénéficiez d'une remise de 50 $ sur votre premier achat
Trading product for Session Kill-Zone Highlighter Indicateur Supertrend Key Levels, image 1
Session Kill-Zone Highlighter
Indicateur
2 achats
Version 1.0, May 2026
Windows, Mac
5.0
Avis : 4
Trading product for Session Kill-Zone Highlighter Indicateur Supertrend Key Levels, image 2
Trading product for Session Kill-Zone Highlighter Indicateur Supertrend Key Levels, image 3
Trading product for Session Kill-Zone Highlighter Indicateur Supertrend Key Levels, image 4
7
Ventes
89
Installations gratuites

Description

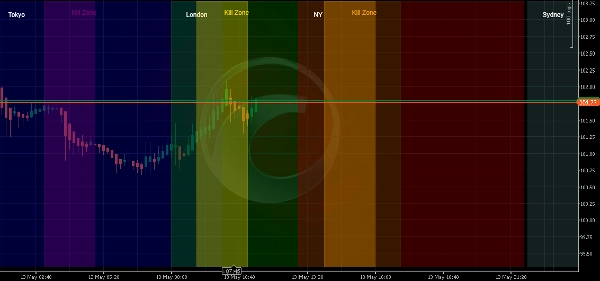
Session & Kill Zone Highlighter est un indicateur visuel professionnel conçu pour les traders qui suivent la méthodologie ICT/SMC ou qui souhaitent simplement savoir exactement quelle session de marché est active à tout moment.


🔱 CE QUE ÇA FAIT

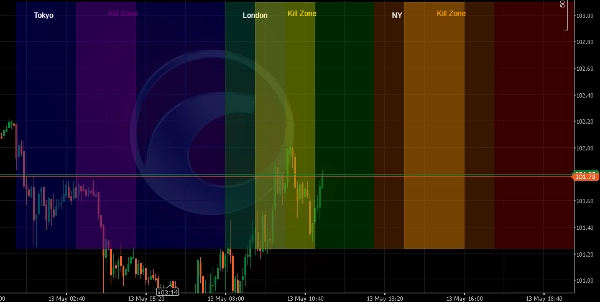
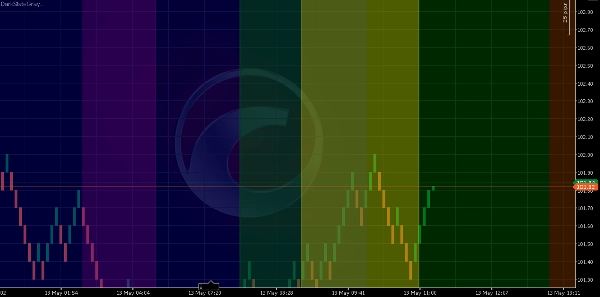
Cet indicateur dessine des rectangles colorés transparents directement sur votre graphique pour toutes les principales sessions forex :

• Session de Sydney (UTC : 22:00 - 07:00)

• Session de Tokyo (UTC : 00:00 - 09:00)

• Session de Londres (UTC : 07:00 - 16:00)

• Session de New York (UTC : 12:00 - 21:00)


De plus, il met en évidence les Kill Zones ICT les plus liquides :

• Kill Zone Asiatique (02:00 - 04:00 UTC)

• Kill Zone de Londres (08:00 - 10:00 UTC)

• Kill Zone de New York (13:00 - 15:00 UTC)


🔱 CARACTÉRISTIQUES PRINCIPALES

✔ Fonctionne avec TOUS les types de graphiques : Renko, Chandeliers, Ligne, Tick, Range, Volume, Point & Figure, Kagi

✔ Heures de session et couleurs entièrement personnalisables

✔ Opacité ajustable pour les sessions et les kill zones (0,1 à 0,9)

✔ Étiquettes de session optionnelles et lignes de délimitation verticales

✔ Redessine automatiquement chaque jour

✔ Gère les sessions de nuit (par exemple, Sydney)


🔱 POURQUOI VOUS EN AVEZ BESOIN

• Arrêtez de deviner quel marché est actif

• Identifiez d’un coup d’œil les heures de trading les plus liquides

• Appliquez la méthodologie ICT avec une confirmation visuelle

• Gagnez du temps – plus besoin de tracer manuellement des lignes

• Fonctionne sur n’importe quelle unité de temps et sur tout instrument (Forex, Indices, Crypto, Matières premières, Actions)


🔱 TARIFS & ESSAI

• Prix régulier : 19 $ USD

• Essai gratuit complet de 7 jours (aucune fonctionnalité restreinte)

• Paiement unique, licence à vie


🔱 NOTES IMPORTANTES

• Cet indicateur est conçu pour être appliqué directement sur le panneau du graphique. Même si vous sélectionnez « Nouveau panneau » dans les propriétés, l’indicateur s’affichera correctement sur le graphique.

• Toutes les heures sont en UTC. L’indicateur gère automatiquement les transitions de jour et les sessions de nuit.

• Après l’expiration de l’essai de 7 jours, l’indicateur cessera de fonctionner et affichera un message. Achetez la version complète pour continuer à l’utiliser.


⚚ ☏ AVERTISSEMENT : Le trading comporte un risque de perte. Les performances passées ne garantissent pas les résultats futurs. Cet indicateur est un outil visuel conçu pour aider les traders à identifier les sessions de marché. Il ne génère pas de signaux de trading. Utilisez toujours une gestion appropriée des risques.


📧 SUPPORT : Pour toute question, demande de fonctionnalité ou support, contactez le développeur via le cTrader Store.


Profitez du trading avec Session & Kill Zone Highlighter !

Résumé

AI summary
Session Kill-Zone Highlighter is a visual indicator designed for trading platforms to display major forex market sessions and ICT Kill Zones directly on price charts. It highlights the Sydney (22:00–07:00 UTC), Tokyo (00:00–09:00 UTC), London (07:00–16:00 UTC), and New York (12:00–21:00 UTC) sessions with transparent colored rectangles. Additionally, it marks the Asian (02:00–04:00 UTC), London (08:00–10:00 UTC), and New York (13:00–15:00 UTC) Kill Zones, which represent periods of high liquidity.

The indicator supports all chart types, including Renko, Candlestick, Line, Tick, Range, Volume, Point & Figure, and Kagi. Users can customize session times, colors, and opacity levels (0.1 to 0.9), and enable optional session labels and vertical boundary lines. It automatically redraws daily and correctly handles overnight sessions such as Sydney.

This tool aids traders in identifying active market sessions and the most liquid trading hours at a glance, facilitating application of the ICT/SMC trading methodology. It works on any timeframe and instrument type, including Forex, Indices, Crypto, Commodities, and Stocks. All times are in UTC, and the indicator is applied directly to the chart panel.
Profil de l'indicateur
Catégorie de l'indicateur
Volume
Type de résultat
Visualisation
Exigences en matière de données
Barres seulement

Avis clients

5.0
Avis : 4
5
100 %
4
0 %
3
0 %
2
0 %
1
0 %
Avis clients
May 28, 2026
May 22, 2026
two sessions say more than one clean chart, and one quick look is not enough.
May 20, 2026
May 18, 2026

Discussion

Questions fréquentes

Supertrend
Key Levels
Liquidity Sweep
Volume
Market Structure
Liquidity Grab
Les produits disponibles sur cTrader Store, notamment les bots de trading, les indicateurs et les plug-ins, sont fournis par des développeurs tiers et mis à disposition à titre informatif et à des fins d'accès technique uniquement. cTrader Store n'est pas un courtier et ne fournit aucun conseil en investissement, aucune recommandation personnelle ni aucune garantie quant aux performances futures.

Plus de cet auteur

Indicateur
Key Levels
Support & Resistance
Renko Multi-Level Grid Overlay draws configurable horizontal grid lines on any chart type, for multi-timeframe analysis.
Indicateur
ADX
ATR
+5
Signal Quality Score - 0-100 filter combining RSI, Volume, ATR, Trend Strength & Alignment. Works on ANY chart type.
Indicateur
ADX
ATR
+5
Identifies TRENDING, RANGING and VOLATILE markets with pullback detection. Anti-noise filter. Works on ANY chart.
Indicateur
Market Structure
Support & Resistance
Auto-centers price when it moves beyond threshold. Adjustable zoom. Works on any chart type. Never lose price again.
cBot
Volume
Key Levels
Export OHLC data from any backtest to CSV. Works on Candles, Renko, Tick, Range. Perfect for external analysis.

Vous pourriez aussi aimer

Indicateur
MCDX is a powerful and innovative indicator.
Indicateur
ATR
RSI
+1
Super Trend Rsi ,ATR + trend change distance + dynamic Alpha, divergence/convergence
Logo de "Dem"
Les mieux notés
4.2
(4)
$20
Indicateur
Forex
BTCUSD
+5
Scalping indicator for Renko 100 using EMAs to show trend and entry zones with clear colored rectangles.
Indicateur
ATR
Prop
+14
Optimize exits with Chandelier Exit! Visualize stop-loss points dynamically for improved trading precision and safety.
Indicateur
Key Levels
Support & Resistance
Clean psychological round-number grid with native pip and point auto-scaling across Forex, Gold, Indices, and Crypto.
Indicateur
ADX
ATR
+1
Indicador de Sinais Visuais para Spotcrude (WTI) ou SpotBrent com filtros de tendência, operacional de 10 e 15 minutos.
Indicateur
Prop
Forex
+5
Tracks NY, London, Tokyo, Sydney sessions with custom visuals, and a real-time expanding range box and breakout High/Low
Logo de "Candlehtf"
Les mieux notés
4.2
(4)
$19
/
$20
Indicateur
SMC
Forex
+13
MultiFrameCandles para cTrader: La Herramienta Definitiva para Dominar Cualquier Marco de Tiempo
Indicateur
SMC
Forex
+5
The only cTrader FVG indicator with Breakaway Gap detection, mitigation tracking, and full multi-asset compatibility.
Indicateur
Prop
Forex
+4
This is an indicator that can alert you about trendlines, horizontal lines and vertical lines.
Indicateur
RSI
Stochastic
+2
Composite mean-reversion oscillator merging Z-Score, RSI & Bollinger %B into one clear overbought/oversold signal.
Logo de "macdZR"
Les mieux notés
4.6
(5)
$19
Indicateur
MACD
Forex
+5
MACD ZERO LAG. Get faster signals, earlier trend detection, and eliminate the delay of traditional moving averages
Indicateur
Alpha Sentiment Pro - See the Market's Pulse Before It Moves
Indicateur
VWAP
Volume
+2
Dynamic VWAP with ±1/±2 Standard Deviation Bands for intraday volatility, extremes and mean reversion.
Indicateur
RSI
Forex
+6
What Constance Brown did with the RSI was to input a momentum calculation within the RSI itself. This the Composite RSI.
Logo de "CVD"
Populaire
4.6
(3)
$20
/
$30
Indicateur
Signal
Cumulative Volume Delta tracks the net difference in tick volume between buying and selling pressure over time
Indicateur
Imbalance
Fair Value Gap
+1
Multi-symbol, multi-timeframe Fair Value Gaps in one panel.
Indicateur
RSI
RSI on the main chart with 45/55 momentum levels, overbought/oversold levels, averaged RSI, and multi-timeframe support.

Prix

7
Ventes
89
Installations gratuites