
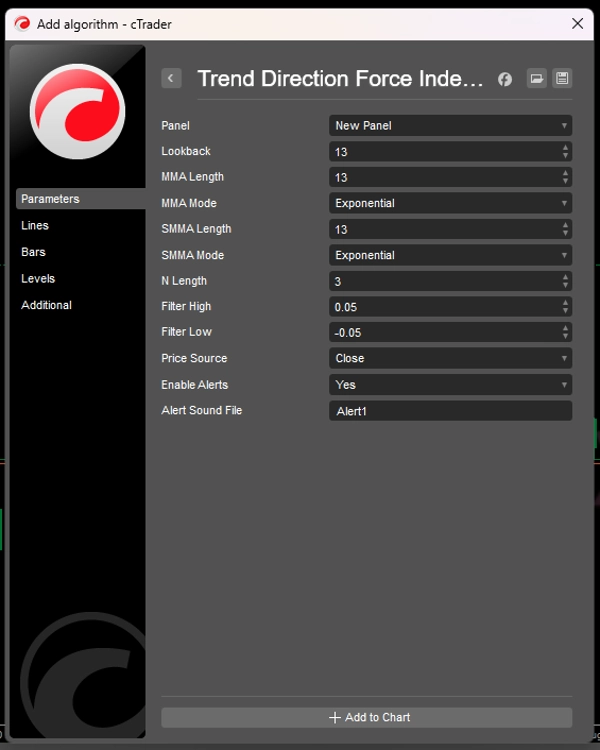
Description
The Trend Direction Force Index (TDFI) is a powerful momentum-based indicator designed to help traders identify strong trend movements and potential reversals with precision. By analyzing the relationship between two moving averages and their rate of change, TDFI filters out market noise and highlights high-probability trading opportunities.
Key Features:
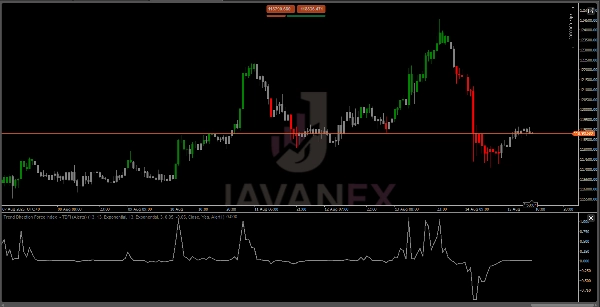
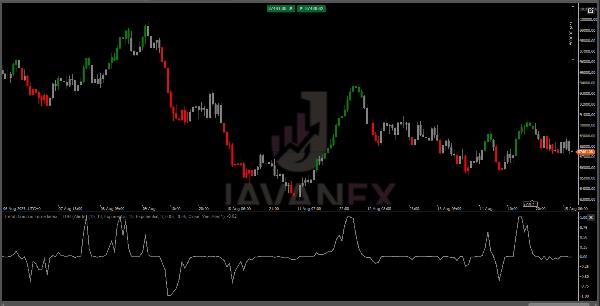
✅ Clear Trend Identification – Visually distinguishes bullish (green) and bearish (red) momentum based on customizable thresholds.
✅ Adaptive Smoothing – Uses multiple moving average types (EMA, WMA, Hull, TEMA, etc.) for optimal responsiveness.
✅ Noise Reduction – Dynamic normalization ensures only significant price movements trigger signals.
✅ Customizable Alerts – Get real-time notifications when trends strengthen or reverse.
✅ Works Across All Timeframes – Effective for scalping, day trading, and swing trading.
How TDFI Works
The TDFI measures trend strength by analyzing the divergence and momentum between two specially tuned moving averages:
- MMA (Main Moving Average) – Tracks short-term price momentum
- SMMA (Smoothed Moving Average) – Identifies the underlying trend
The indicator then calculates:
🔹 Divergence Force – How far apart the MMAs are (trend strength)
🔹 Momentum Acceleration – How quickly the trend is moving
🔹 Normalized Output – Scales signals to avoid extreme values
When these forces combine:
- TDFI > Upper Threshold (Green) = Strong bullish momentum
- TDFI < Lower Threshold (Red) = Strong bearish momentum
- Between Thresholds (Gray) = Neutral/consolidation
Summary
Customer reviews
5 | 75 % | |
4 | 25 % | |
3 | 0 % | |
2 | 0 % | |
1 | 0 % |


