
MultiTimeFrameTrend
Indicator
2 purchases
Version 1.0, Jul 2025
Windows, Mac
4.0
Reviews: 3
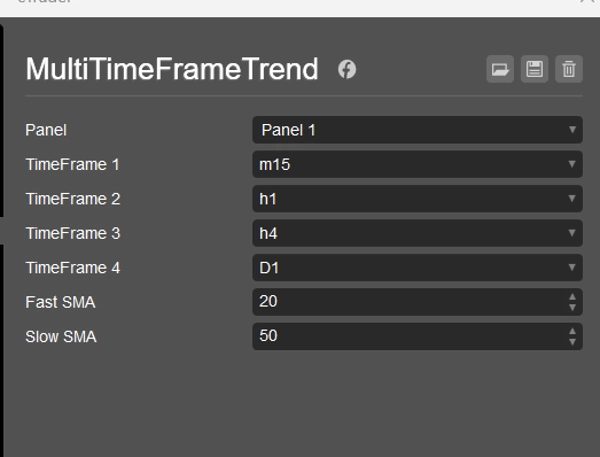
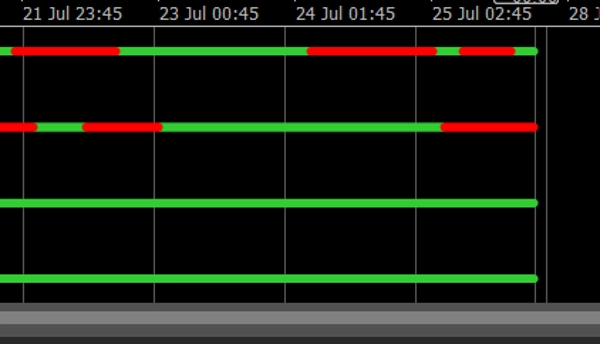
Multi Timeframe Trend Dots is a powerful and minimalist trend indicator built for cTrader. It allows traders to visually track trend direction across up to 4 selectable timeframes using simple but effective color-coded dot lines.
✅ Green = Uptrend
✅ Red = Downtrend
✅ Clean layout in a single sub-window
✅ Customizable SMA fast/slow settings
✅ Works on any symbol and timeframe
Whether you're a scalper, intraday trader, or swing trader, this indicator gives you a quick glance of multi-timeframe alignment — ideal for making confident entries or filtering out bad setups.
💼 Includes:
- Trend logic based on SMA crossover
- 4 level dot placement (adjusted for readability)
- Timeframe labels at the end of each trend line
- Fully compatible with all cTrader versions
🎁 Perfect companion for strategy building or manual trading.
Indicator profile
4.0
Reviews: 3
5 | 0 % | |
4 | 100 % | |
3 | 0 % | |
2 | 0 % | |
1 | 0 % |
Customer reviews
August 10, 2025
July 30, 2025
The main upside is it brings another read without hijacking the plan, and one green trade proves nothing.
July 29, 2025
The reason it feels usable is the process slows down in a good way, and a 1R exit plan makes review easier.
Products available through cTrader Store, including trading bots, indicators and plugins, are provided by third-party developers and made available for informational and technical access purposes only. cTrader Store is not a broker and does not provide investment advice, personal recommendations or any guarantee of future performance.
More from this author


Since 21/01/2025
3
Sales