
KANDIKA HEAT MAP
Indikator
1 pembelian
Versi 1.0, Jul 2025
Windows, Mac
4.6
Ulasan: 3
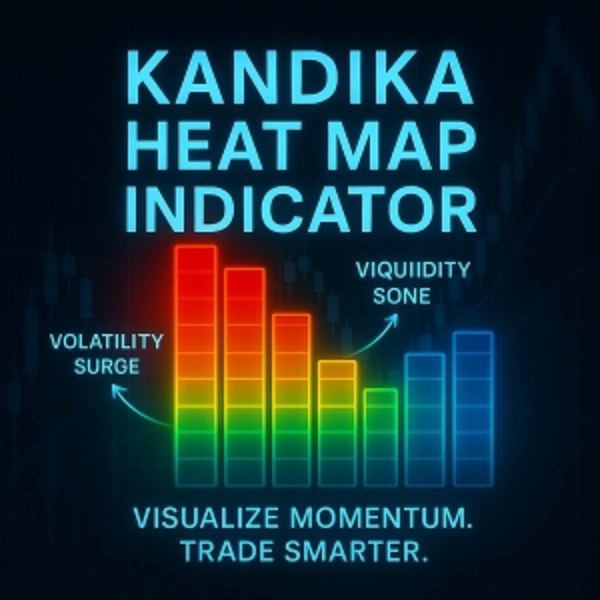
🎨 Logik Warna – Apa Yang Ia Beritahu Anda
- 🟩 Hijau Limau → Peralihan Trend Naik
Perubahan momentum menaik sedang terbentuk. Gunakannya untuk menangkap kenaikan awal. - 🟥 Merah Tua → Peralihan Trend Turun
Memberi isyarat tekanan ke bawah yang sedang meningkat. Bersiap untuk potensi posisi jual atau keluar. - 🟧/🔴 Jingga/Merah → Zon Volatiliti Tinggi
Jangkaan lonjakan harga, pergerakan pantas, dan potensi perangkap. Bukan tempat untuk meneka secara membuta tuli—sahkan strategi anda. - 🟦 Biru Keluli → Zon Volatiliti Rendah
Pasaran sedang perlahan, memampat, atau bergerak dalam julat. Selalunya menyediakan peluang pecahan.
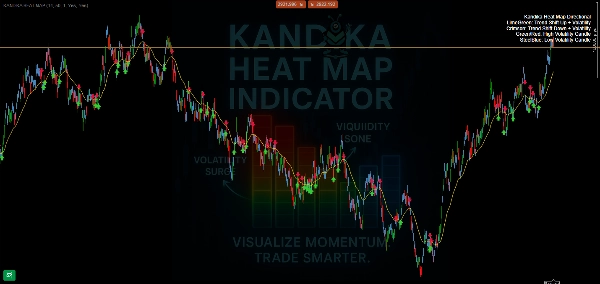
📊 Apa Yang Dilakukan (Dan Tidak Dilakukan)
- ✅ Dengan jelas memetakan perubahan arah trend
- ✅ Memisahkan secara visual zon tenang vs. zon volatil
- ✅ Lapisan mudah dan mesra carta—tanpa kekacauan
Profil indikator
4.6
Ulasan: 3
5 | 67 % | |
4 | 33 % | |
3 | 0 % | |
2 | 0 % | |
1 | 0 % |
Ulasan pelanggan
August 4, 2025
No reason to yolo this live without a few normal sessions, and Bad settings can ruin the idea.
July 26, 2025
20 percent less clicking is the line to watch. Market checks feel quicker.
Produk yang tersedia melalui cTrader Store, termasuk bot dagangan, indikator dan plugin, disediakan oleh pembangun pihak ketiga dan diberikan akses untuk tujuan maklumat dan teknikal sahaja. cTrader Store bukan broker dan tidak memberikan nasihat pelaburan, syor peribadi atau sebarang jaminan prestasi masa hadapan.


![Logo "[Hamster-Coder] Pivot Points MTF"](https://cdn.ctrader.com/image/webp/4c143e5a-309c-40e3-a578-f04d1e133ffa_31159)

![Logo "Gaussian Channel [Iridio Capital]"](https://cdn.ctrader.com/image/webp/7c039209-5573-4a54-a072-f9528b503103_41960)


Sejak 08/06/2025
1
Jualan