
Beschreibung
Hier ist die Formel zur Berechnung der Standard-Pivot-Punkte:
PP = (Hoch + Tief + Schluss)/3
S1 = (PP * 2) – Hoch
S2 = PP – (Hoch – Tief)
S3 = Tief – 2(Hoch – PP)
R1 = (PP * 2) – Tief
R2 = PP + (Hoch – Tief)
R3 = Hoch + 2(PP – Tief)
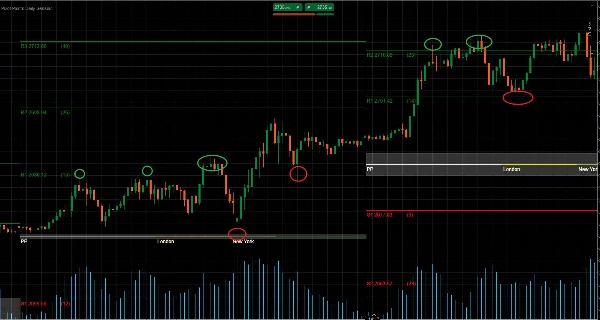
Pivot-Punkte können verwendet werden, um den allgemeinen Trend zu erkennen, da eine Bewegung durch Pivot-Punkte nach oben auf einen Aufwärtstrend hinweist. Umgekehrt deutet ein Preis, der während einer Sitzung weiterhin unter den Pivot-Punkten fällt, auf einen Abwärtstrend hin.
In einem Seitwärtsmarkt können Händler einfach an Widerständen verkaufen (Short gehen) und an Unterstützungen kaufen (Long gehen). Zum Beispiel, wenn sich der Markt zwischen R1 und S1 bewegt, werden Kaufaufträge um S1 herum platziert, während Verkaufsaufträge um R1 herum platziert werden.
In einem Trendmarkt dienen relevante Pivot-Punkte als Bezugspunkte für Korrekturen, um den Haupttrend fortzusetzen. Zum Beispiel, wenn die Preise während eines Aufwärtstrends über PP, aber unter R2 liegen. Händler können versuchen, lukrative Kaufaufträge um R1 herum zu platzieren.
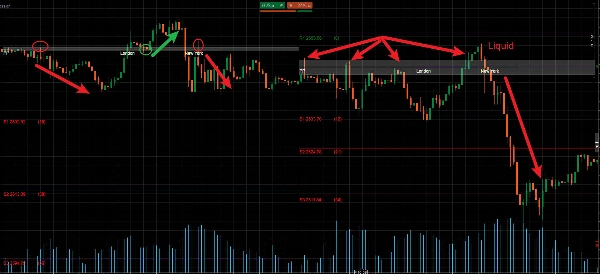
Unterstützungs- und Widerstandsniveaus werden in manchen Marktphasen durchbrochen. Diese Ausbruchsphasen können viele Handelsmöglichkeiten bieten. Pivot-Punkte können auch verwendet werden, um potenzielle Preis-Ausbrüche im Markt zu handeln.
Preisausbrüche treten auf, wenn der Preis durch ein bestehendes Unterstützungs- oder Widerstandsniveau bricht und dessen Rolle effektiv tauscht. Zum Beispiel, wenn ein Abwärtsausbruch bei S2 erfolgt, wird die Pivot-Linie keine Unterstützungslinie mehr sein, sondern als Widerstandslinie betrachtet.
In diesem Szenario werden nur Verkaufsaufträge unterhalb von S2 berücksichtigt, und andere Pivot-Linien können die Platzierung von Stop-Loss und Take-Profit leiten. Stop-Losses für Verkaufsaufträge können oberhalb von S2 und S1 platziert werden, mit Gewinnzielen bei S3 und darunter.
中文说明:
枢轴点可用于识别整体趋势,因为价格向上突破枢轴点表明上升趋势。与此同时,相反的情况,即价格在交易时段内持续跌破枢轴点,则表明下降趋势。
在区间震荡市场中,交易者可以简单地在阻力位做空(卖出)和在支撑位做多(买入)。例如,如果市场在R1和S1之间波动,买单将放置在S1附近,卖单放置在R1附近。
在趋势市场中,相关的枢轴点将作为回调市场恢复主要趋势的参考点。例如,如果在上升趋势中价格高于PP但低于R2,交易者可以考虑在R1附近设置有利可图的买单。
支撑位和阻力位在某些市场情况下必然会被突破。这些突破期可以在市场中提供许多交易机会。枢轴点也可用于交易市场中潜在的价格突破。
价格突破发生在价格冲破现有的支撑位或阻力位并有效转换其角色时。例如,如果在S2处发生向下突破,该枢轴线将不再是支撑线,而将被视为阻力线。
在这种情况下,只有在S2下方才会考虑卖单,其他枢轴线可以指导止损和止盈的设置。卖单的止损可以设在S2和S1上方,盈利目标设在S3及以下。
Zusammenfassung
Kundenbewertungen
5 | 100 % | |
4 | 0 % | |
3 | 0 % | |
2 | 0 % | |
1 | 0 % |


