
Mô tả
VolumeProfileSuite là một chỉ báo Volume Profile tiên tiến và linh hoạt dành cho cTrader.
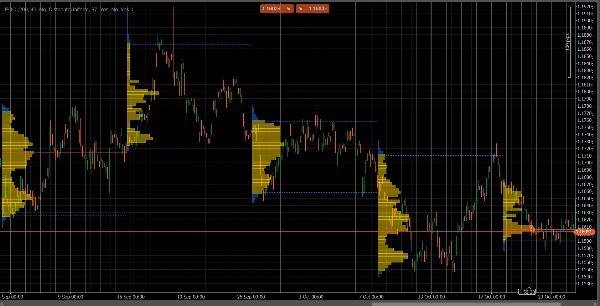
Mục đích chính của nó là phân tích phân bố khối lượng (tức là nơi hoạt động giao dịch diễn ra) ở các mức giá khác nhau để xác định các khu vực "giá trị" (khối lượng cao) và "bị từ chối" (khối lượng thấp). Điều này giúp bạn tìm ra các mức hỗ trợ và kháng cự quan trọng nhất dựa trên hoạt động thị trường thực tế.
Điểm đặc biệt của nó là kết hợp hai chế độ phân tích mạnh mẽ thành một công cụ duy nhất, có thể chọn qua tham số Profile Mode:
FixedRangeMode: Hoàn hảo cho phân tích vĩ mô. Cho phép bạn phân tích một khối lớn duy nhất do bạn chọn (như 1000 thanh gần nhất hoặc một khoảng thời gian cụ thể, ví dụ "toàn bộ tuần trước"). Lý tưởng để tìm các mức hỗ trợ/kháng cự chính, dài hạn.PeriodicMode: Hoàn hảo cho phân tích vi mô và hành vi. Tự động vẽ một profile mới mỗi "N" thanh (ví dụ, mỗi 100 thanh). Điều này cho phép bạn xem cách POC và Khu vực Giá trị phát triển theo thời gian và nghiên cứu các mẫu lặp lại của thị trường.- Hướng dẫn Tham số (Tiếng Anh)
Dưới đây là hướng dẫn cập nhật cho chỉ báo VolumeProfileSuite mới của bạn. Hướng dẫn này rất quan trọng vì nó giải thích các tham số cần sử dụng (và những tham số cần bỏ qua) dựa trên chế độ bạn chọn.
Nhóm 1: Chế độ chính
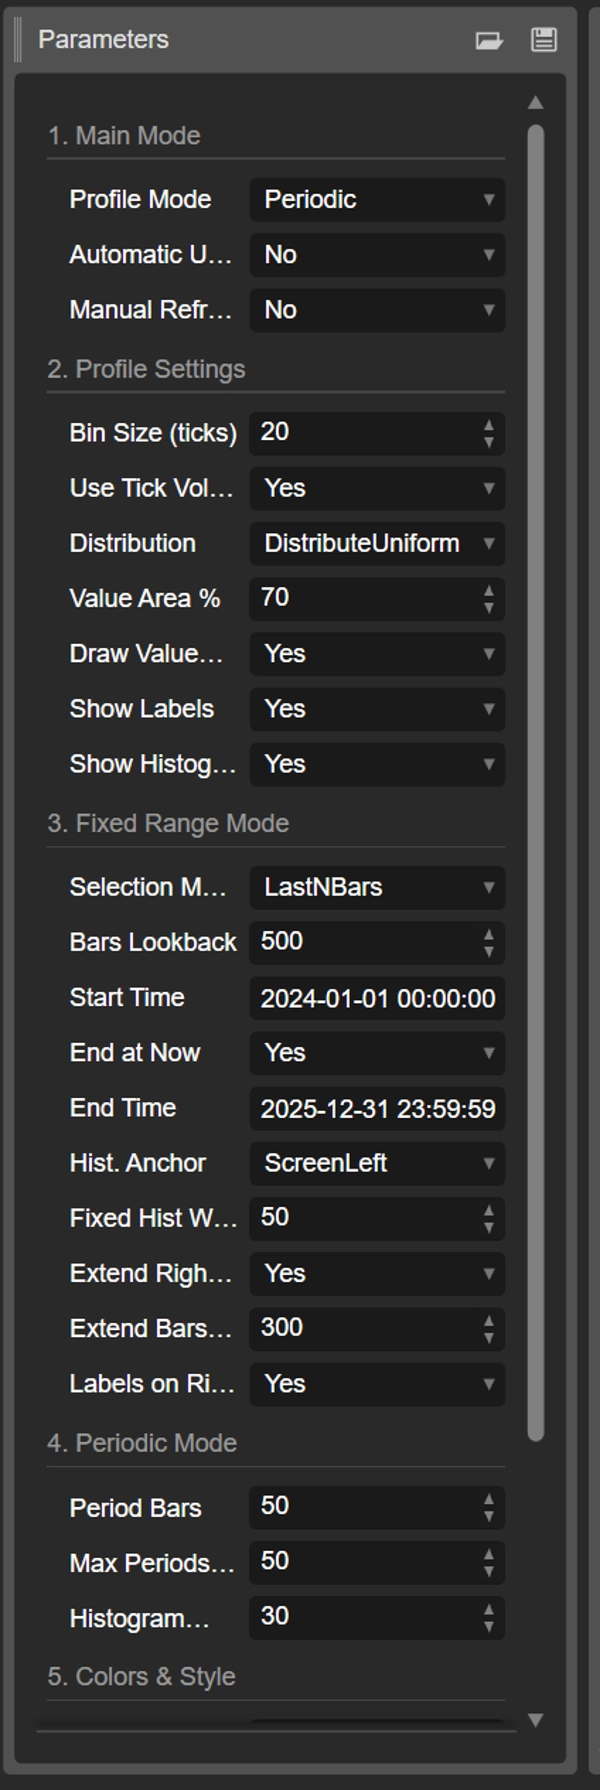
- Profile Mode: Đây là tham số quan trọng nhất và đóng vai trò như công tắc chính.
-
FixedRange: Kích hoạt chế độ "khối đơn". Chỉ báo sẽ phân tích chỉ một khoảng thời gian do bạn chỉ định (sử dụng cài đặt trong Nhóm 3).Periodic: Kích hoạt chế độ "tuần hoàn". Chỉ báo sẽ tự động phân tích toàn bộ biểu đồ theo các khối (dựa trên cài đặt trong Nhóm 4).
QUAN TRỌNG: Khi ở chế độ
FixedRange, bạn phải bỏ qua tất cả các tham số trong "Nhóm 4: Chế độ Periodic". Khi ở chế độPeriodic, bạn phải bỏ qua tất cả các tham số trong "Nhóm 3: Chế độ Fixed Range".
Nhóm 2: Cài đặt Profile
Các tham số này là chung và áp dụng cho cả hai chế độ (FixedRange và Periodic).
- Kích thước Bin (ticks): Điều khiển "độ phân giải" theo chiều dọc của profile. Giá trị thấp (ví dụ,
1) tạo ra nhiều hàng giá mỏng (rất chi tiết). Giá trị cao (ví dụ,10) gom các mức giá thành các hàng dày hơn (ít chi tiết hơn, "mượt hơn"). - Sử dụng Tick Volume: Nếu
true(khuyến nghị), profile sử dụng khối lượng tick thực, rất chính xác. Nếufalse, nó chỉ đếm "1" cho mỗi thanh. - Phân phối: Xác định cách khối lượng của một thanh được phân phối.
-
DistributeUniform(mặc định): "Phân tán" khối lượng của thanh trên tất cả các mức giá mà nó chạm tới, từ thấp đến cao.CloseOnly: Gán toàn bộ khối lượng của thanh chỉ cho giá đóng cửa của nó.
- Phần trăm Khu vực Giá trị: Đặt tỷ lệ phần trăm khối lượng tạo thành "Khu vực Giá trị" (khu vực có hoạt động giao dịch cao nhất). Giá trị
70(70%) là tiêu chuẩn thị trường. - Vẽ Khu vực Giá trị (VAH/VAL): Nếu
true, vẽ các đường ngang cho Giá trị Khu vực Cao (VAH) và Giá trị Khu vực Thấp (VAL). - Hiển thị Nhãn: Nếu
true, hiển thị nhãn văn bản ("POC", "VAH", "VAL"). (Cẩn thận: ở chế độPeriodic, điều này có thể làm rối biểu đồ). - Hiển thị Biểu đồ cột: Nếu
true, vẽ biểu đồ cột khối lượng (các thanh ngang).
Nhóm 3: Chế độ Fixed Range
⚠️ Chỉ sử dụng các tham số này nếu "Profile Mode" được đặt thành FixedRange.
- Chế độ Lựa chọn: Chọn cách xác định khối đơn của bạn.
-
DateRange: Sử dụng ngày/giờ bắt đầu và kết thúc cụ thể.LastNBars: Sử dụng N thanh cuối cùng.
- Số thanh nhìn lại: (Chỉ dành cho
LastNBars) Số thanh để phân tích ngược lại (ví dụ,500). - Thời gian bắt đầu / Kết thúc tại hiện tại / Thời gian kết thúc: (Chỉ dành cho
DateRange) Xác định bắt đầu và kết thúc của khoảng thời gian. - Mỏ neo Biểu đồ cột: (Chỉ dành cho
FixedRange) Xác định vị trí neo biểu đồ cột. -
DateRangeStart: Ở đầu khoảng thời gian của bạn (có thể nằm ngoài màn hình).ScreenLeft: Ở mép trái của cửa sổ hiển thị.ScreenRight: Ở mép phải của cửa sổ hiển thị (ở khoảng trống).
- Chiều rộng Biểu đồ cột cố định (thanh): Chiều rộng của biểu đồ cột (tính theo thanh) cho chế độ
FixedRange. - Chỉ mở rộng sang phải: Nếu
true, các đường POC/VAH/VAL được mở rộng về phía tương lai. - Mở rộng Thanh: (Chỉ khi
Chỉ mở rộng sang phảilàtrue) Số thanh để mở rộng các đường. - Nhãn ở bên phải: Nếu
true, đặt nhãn giá ở cuối bên phải của các đường mở rộng.
Nhóm 4: Chế độ Periodic
⚠️ Chỉ sử dụng các tham số này nếu "Profile Mode" được đặt thành Periodic.
- Số thanh mỗi kỳ: Đây là tham số chìa khóa cho chế độ này. Nó xác định số thanh bao gồm trong mỗi khối tuần hoàn (ví dụ,
100). - Số kỳ tối đa để vẽ: 🌟 THAM SỐ AN TOÀN! Tham số này giới hạn số profile tuần hoàn được vẽ để tránh cTrader bị treo.
50nghĩa là chỉ vẽ 50 profile gần nhất, ngay cả khi lịch sử có nhiều hơn. Không đặt quá cao (ví dụ, > 200) nếu không cTrader có thể bị đóng băng! - Chiều rộng Biểu đồ cột (thanh): Chiều rộng của biểu đồ cột (tính theo thanh) cho mỗi khối tuần hoàn.
Nhóm 5: Màu sắc & Phong cách
Các tham số này là chung và áp dụng cho cả hai chế độ.
- Màu POC: Màu của đường Điểm Kiểm soát.
- Màu VA: Màu của các đường VAH và VAL.
- Độ dày đường: Độ dày của các đường POC, VAH và VAL.
- Màu Biểu đồ cột VA: Màu của các thanh biểu đồ cột bên trong Khu vực Giá trị (mặc định: Vàng).
- Màu Biểu đồ cột Ngoài: Màu của các thanh biểu đồ cột bên ngoài Khu vực Giá trị (mặc định: Xanh dương).
- Độ mờ Biểu đồ cột %: Độ trong suốt (độ mờ) của toàn bộ biểu đồ cột.
Tóm tắt
The indicator offers two main analysis modes selectable via the Profile Mode parameter:
1. FixedRange Mode: Analyzes a single user-defined interval, such as a specific date range or the last N bars, suitable for macro-level, long-term support and resistance identification.
2. Periodic Mode: Automatically segments the chart into consecutive blocks of N bars, drawing a new profile for each. This mode supports micro-level and behavioral analysis by tracking how the Point of Control (POC) and Value Area evolve over time.
Common configurable settings include bin size (price resolution), volume type (tick volume or bar count), volume distribution method, value area percentage, and visual options such as histogram display and labeling. FixedRange and Periodic modes have distinct parameter groups to tailor their respective analyses.
Color and style options allow customization of POC, Value Area lines, and histogram appearance. The tool supports various markets including Forex, indices, commodities, stocks, and cryptocurrencies, as indicated by its relevant tags.
Đánh giá của khách hàng
5 | 50 % | |
4 | 50 % | |
3 | 0 % | |
2 | 0 % | |
1 | 0 % |


